Answer the following questions:
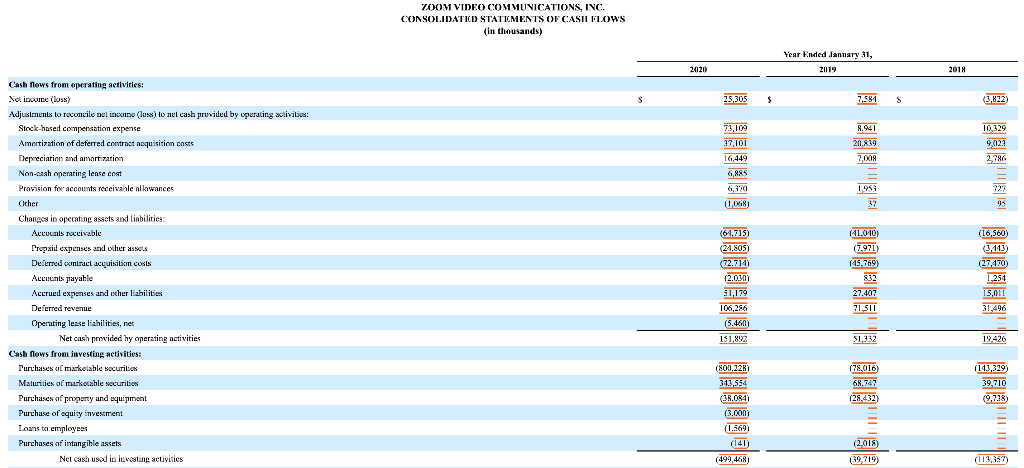
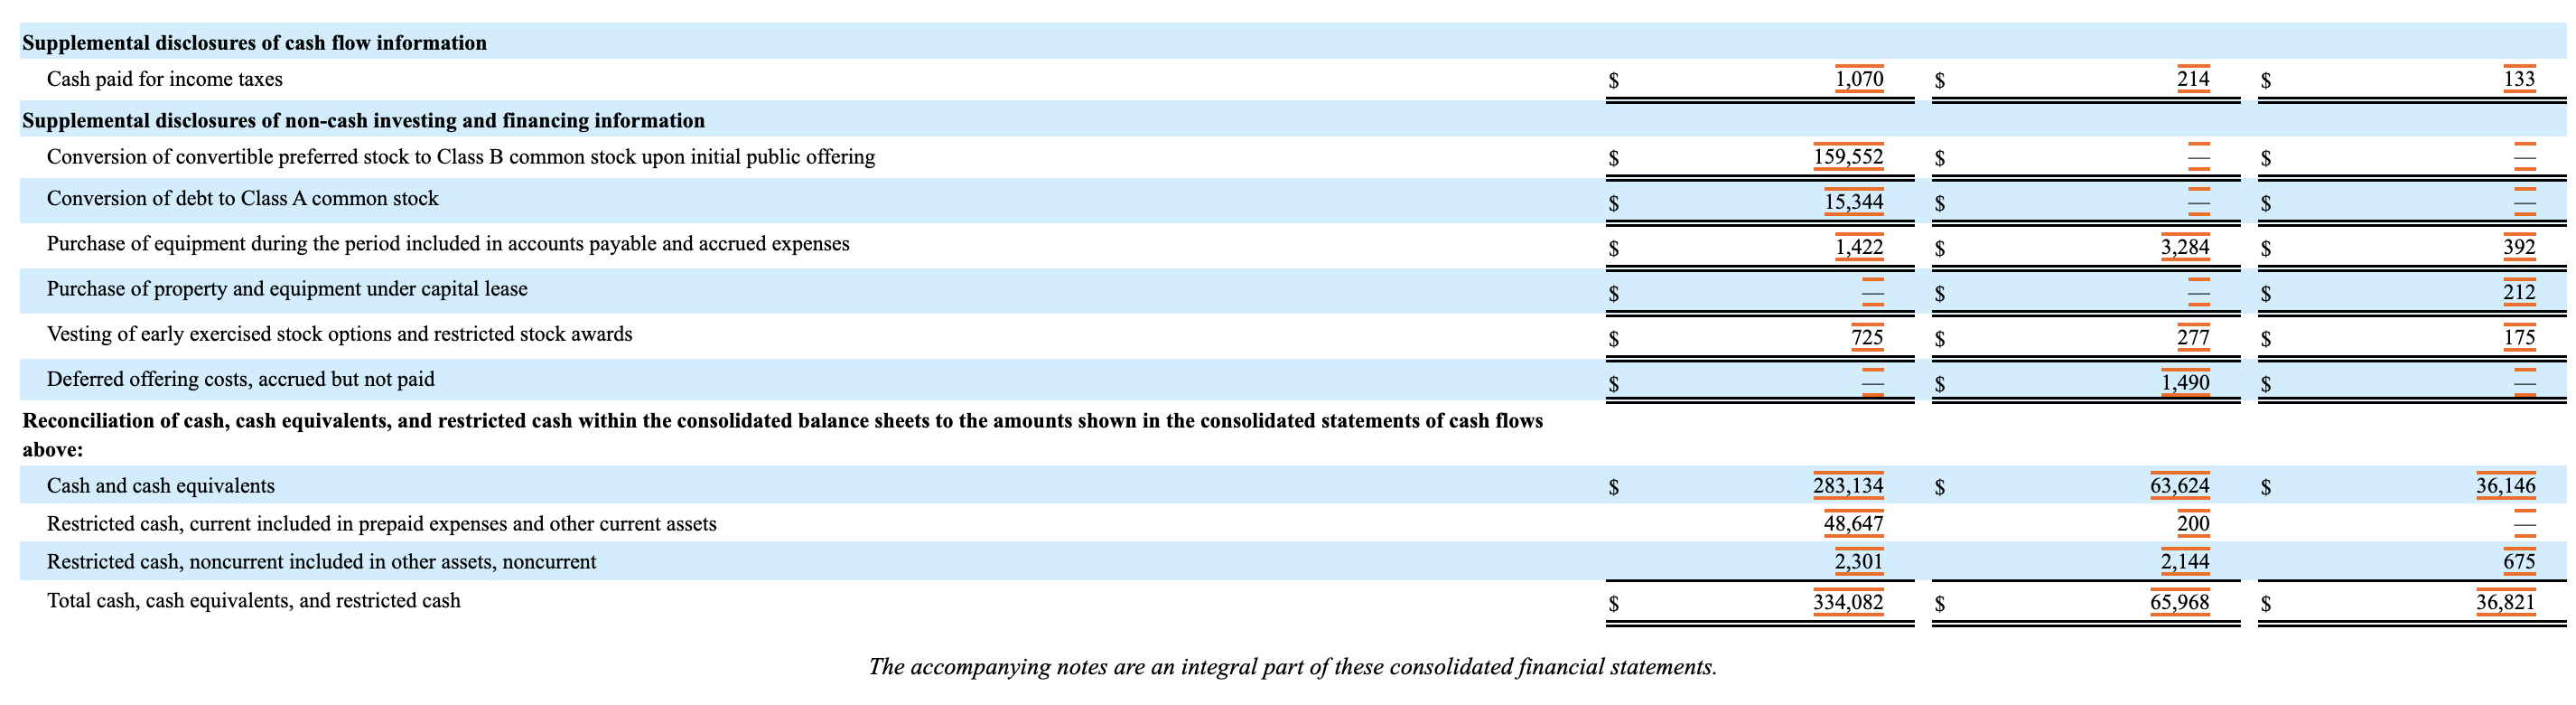
a) How much did Zoom have in cash and short-term investments as of January 31, 2020?
b) What is the value of Zooms total assets?
c) What is the value of Zooms long-term debt?
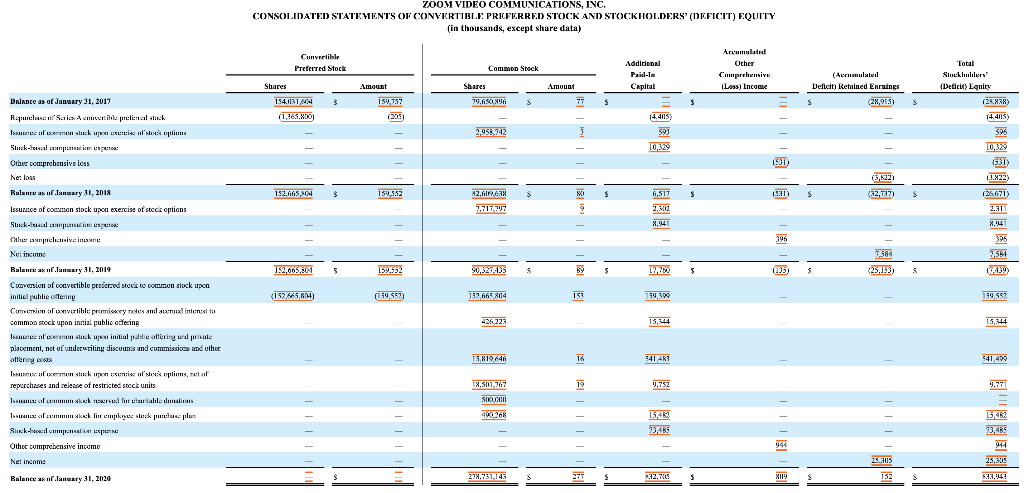
d) What was the book value of Zooms equity?
e) Is Zoom a profitable company?
f) What was Zooms largest expense item for the fiscal year that ended on January 31, 2020.
g) Compute Zooms gross and net profit margin. Which one is larger? What is the theoretical relationship between gross and net margins, i.e., should one always be larger than the other one?
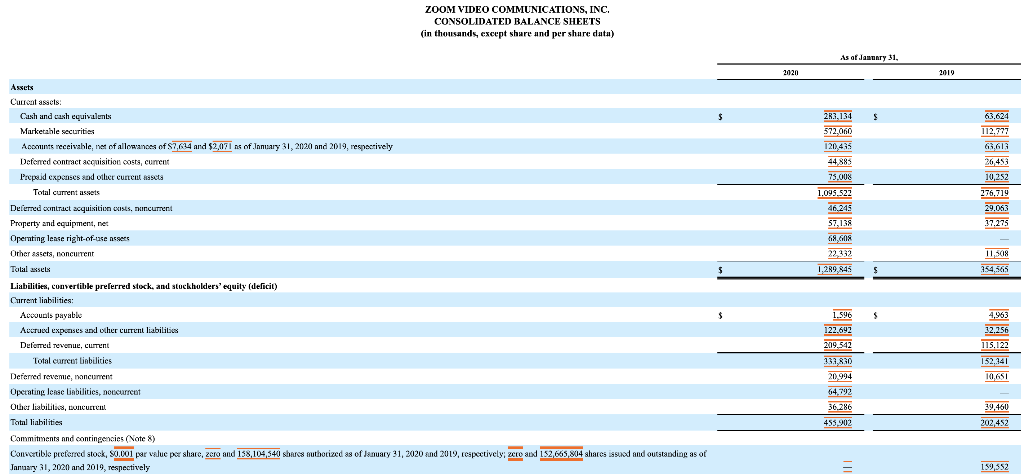
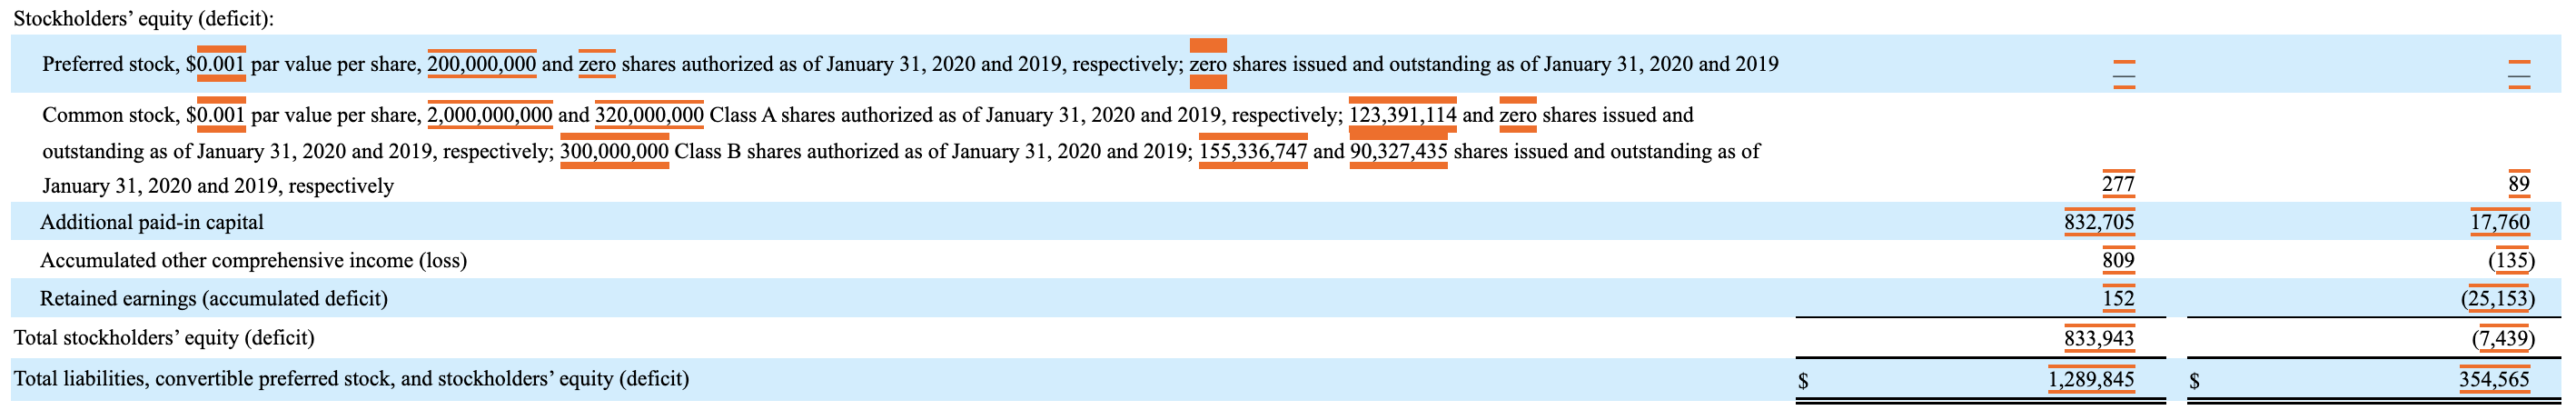
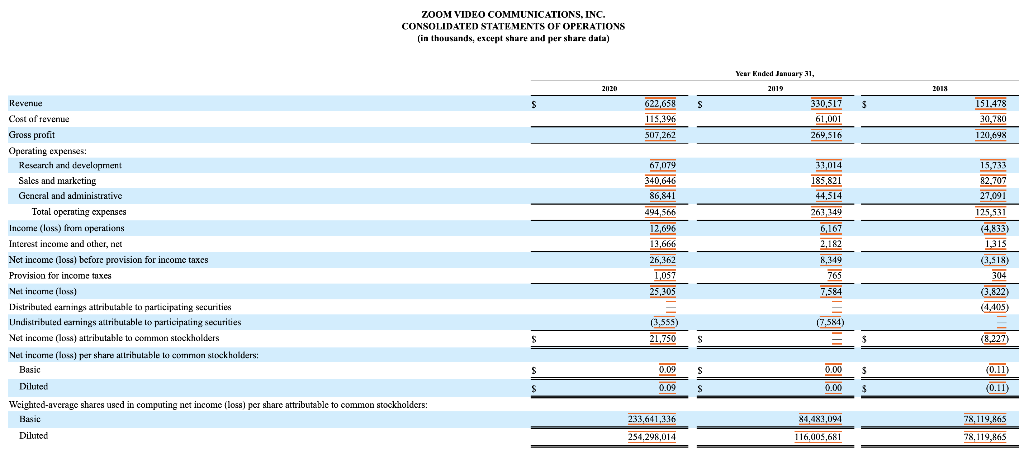
Assets Current assets: Cash and cash equivalents Marketable securities Accounts receivable, net of allowances of $7,634 and $2,071 as of January 31, 2020 and 2019, respectively Deferred contract acquisition costs, current Prepaid expenses and other current assets Total current assets Deferred contract acquisition costs, nuncurrent Property and equipment, net Operating lease right-of-use assers Orher assets, noncurrent Total assets Liabilities, convertible preferred stock, and stockholders' equity (deficit) Current liabilities: Accounts payable Accrued expenses and other current liabilities Deferred revenue, current Total current liabilities Deferred revenue, noncurent Operating lease liabilities, noncurrent Other liabilities, concurrent Total liabilities ZOOM VIDEO COMMUNICATIONS, INC. CONSOLIDATED BALANCE SHEETS (in thousands, except share and per share data) Commitments and contingencies (Note 8) Convertible preferred stock, $0.001 par value per share, zero and 158,104,540 shares authorized as of January 31, 2020 and 2019, respectively; zero and 152,665,804 shares issued and outstanding as of January 31, 2020 and 2019, respectively $ 2020 As of January 31, 283,134 572,060 120,435 44,885 75,008 1.095.522 46,245 57,138 68,608 22,332 1,289,845 1.596 122.692 209.542 333,830 20,994 64,792 36,286 455.902 S 2019 63,624 112,777 63.613 26,453 10,252 276,719 29.063 37,275 11,508 354,565 4,963 32,256 115,122 152,341 10,651 39,460 202,452 159,552 Stockholders' equity (deficit): Preferred stock, $0.001 par value per share, 200,000,000 and zero shares authorized as of January 31, 2020 and 2019, respectively; zero shares issued and outstanding as of January 31, 2020 and 2019 Common stock, $0.001 par value per share, 2,000,000,000 and 320,000,000 Class A shares authorized as of January 31, 2020 and 2019, respectively; 123,391,114 and zero shares issued and outstanding as of January 31, 2020 and 2019, respectively; 300,000,000 Class B shares authorized as of January 31, 2020 and 2019; 155,336,747 and 90,327,435 shares issued and outstanding as of January 31, 2020 and 2019, respectively Additional paid-in capital Accumulated other comprehensive income (loss) Retained earnings (accumulated deficit) Total stockholders' equity (deficit) Total liabilities, convertible preferred stock, and stockholders' equity (deficit) $ ||| 277 832,705 809 152 833,943 1,289,845 $ 89 17,760 (135) (25,153) (7,439) 354,565 Revenue Cost of revenue Gross profit Operating expenses: Research and development Sales and marketing General and administrative Total operating expenses Income (loss) from operations Interest income and other, net Net income (loss) before provision for income taxes Provision for income taxes Net income (loss) Distributed earnings attributable to participating securities Undistributed earnings attributable to participating securities Net income (loss) attributable to common stockholders ZOOM VIDEO COMMUNICATIONS, INC. CONSOLIDATED STATEMENTS OF OPERATIONS (in thousands, except share and per share data) Net income (loss) per share attributable to common stockholders: Dacia Basic Diluted Weighted-average shares used in computing net income (loss) per share attributable to common stockholders: Basic Diluted S S S $ 20120 622,658 115,396 507,262 67,079 340,646 86,841 494,566 12,696 13,666 26,362 1,057 25,305 (3,555) 21,750 0.09 0.09 233,641,336 254,298,014 S S S S Year Ended January 31, 2019 330,517 61,001 269,516 33,014 185,821 44.514 263.349 6,167 2,182 8,349 765 7,584 (7,584) 0.00 0.00 84,483,094 116,005,681 3 3 $ 2018 151,478 30,780 120,698 15,733 82,707 27,091 125,531 (4,833) 1,315 (3,518) 304 (3,822) (4,405) (8,227) (0.11) (0.11) 78,119,865 78,119,865 Net income (loss) Other comprehensive income (loss): Unrealized gain (loss) on available-for-sale marketable securities, net of tax Comprehensive income (loss) ZOOM VIDEO COMMUNICATIONS, INC. CONSOLIDATED STATEMENTS OF COMPREHENSIVE INCOME (LOSS) (in thousands) $ $ 2020 25,305 944 26,249 The accompanying notes are an integral part of these consolidated financial statements. $ $ Year Ended January 31, 2019 7,584 396 7,980 $ $ 2018 (3,822) (531) (4,353) Balance as of January 31, 2017 Repurchase of Series A convertible prefered stock Issange of men slock upon exercise of stock options Stuck-lusal compensation usperos Other comprehensive less Net loss Balance as of January 31, 2018 Issuance of common stock upon exercise of stocis options Stock-basal compensation expens Other comprehensive income Net income Balance as of January 31, 2019 Conversion of convertible preferred stock to common stock upon initial public offering Conversion of convertible promissory notes and accrued interest to common stock upon initial public offering Issuance of common stock upon initial public offering and private placement, not of underwriting discounts and commissions and other offering costs Issue of common stock upon exercise of stock options, net of repurchases and release of restricted stock units Issuance of common skoek reserved for charitable donations Issuance of common stock for employee stock purchase plas Stock-bused compensation esponse Other comprehensive income Net income Balance as of January 31, 2020 ZOOM VIDEO COMMUNICATIONS, INC. CONSOLIDATED STATEMENTS OF CONVERTIBLE PREFERRED STOCK AND STOCKHOLDERS' (DEFICIT) EQUITY (in thousands, except share data) Shares Convertible Preferred Stock 154.031.604 (1,365,800) 152.665,304 152,665,801 (152,665,804) $ $ Amount 159,757 (205) 159,332 159.552 (159,552) Shares Common Stock 79,650,006 $5.958,742 82,609,638 7.717.797 152,665 804 426,223 15,819,646 18,501,767 SIOUCER 490 268 278,731,148 S S Amount 77 - NO B9 153 16 19 - 277 $ $ $ Additional Paid-In Capital (4.4115) 593 10.329 6,517 2,302 8,941 159,300 15,344 541 4R1 9,752 - 15,482 73,485 832,705 $ $ $ Accumulated Other Comprehensive (Loss) Income (531) (531) 396 (135) - 944 809 (Accumulated Deficit) Retained Earnings (28,915) S S (3,822) (32,737) 7.584 (25,153) 25.305 152 S S s Total Stockholders' (Deficit) Equity (28,838) (4.4115) 595 10,329 (531) (3.822) (25.671) 2.311 8,941 395 7,584 159,552 15,344 Batman 541,499 13,771 15,482 944 25,305 833,943 Cash flows from operating activities: Not income (loss) Adjustments to reconcile net income (loss) to net cash provided by operating activities: Stock-hased compensation expense Amortization of deferred contract acquisition costs Depreciation and amortization Non-cash operating lease cost Provision for accounts receivable allowances Other Changes in operating assets and liabilities: Accounts receivable Prepaid expenses and other assets Deferred contract acquisition costs Accounts payable Accrued expenses and other liabilities Deferred revenue Operating lease liabilities, net Net cash provided by operating activities Cash flo flows from investing activities: Purchases of marketable securities Maturities of marketable securities Purchases of property and equipment Purchase of equity investment Loans to employees Purchases of intangible assets Net cash used in investing activities ZOOM VIDEO COMMUNICATIONS, INC. CONSOLIDATED STATEMENTS OF CASH FLOWS (in thousands) $ 2020 25,305 37,101 16,449 6,885 6,370 (1,068) (64,715) (24,805) (72.714) (2.030) 51,179 106,286 (5.460) 151,892 (800,228) 343,554 (38.084) (3.000) (1.569) (499,468) $ Year Ended January 31, 2019 7,584 8,941 20,839 7,008 - 1,953 37 (41,040) (7,971) (45,769) 832 27.407 71,511 $1,332 (78,016) 68.747 (28,432) = (2,018) (39,719) S 2018 0 2*** 809*EN' 1 000 0 (3,822) (113,357) Cash flows from financing activities: Proceeds from initial public offering and private placement, net of underwriting discounts and commissions and other offering costs Proceeds from international employee stock sales to be remitted to employees and tax authorities Proceeds from issuance of common stock for employee stock purchase plan Proceeds from exercise of stock options, net of repurchases Proceeds from issuance of convertible promissory notes and derivatives Principal payments on capital lease obligations Repurchase of convertible preferred stock Net cash provided by (used in) financing activities Net increase (decrease) in cash, cash equivalents, and restricted cash Cash, cash equivalents, and restricted cash-beginning of period Cash, cash equivalents, and restricted cash-end of period $ 542,492 48,547 15,482 9,169 615,690 268,114 65,968 334,082 $ (939) |||||||| 3,565 15,000 (92) 17,534 29,147 36,821 65,968 $ 733 (120) (4,610) (3,997) (97,928) 134,749 36,821 Supplemental disclosures of cash flow information Cash paid for income taxes Supplemental disclosures of non-cash investing and financing information Conversion of convertible preferred stock to Class B common stock upon initial public offering Conversion of debt to Class A common stock Purchase of equipment during the period included in accounts payable and accrued expenses Purchase of property and equipment under capital lease Vesting of early exercised stock options and restricted stock awards Deferred offering costs, accrued but not paid Reconciliation of cash, cash equivalents, and restricted cash within the consolidated balance sheets to the amounts shown in the consolidated statements of cash flows above: Cash and cash equivalents Restricted cash, current included in prepaid expenses and other current assets Restricted cash, noncurrent included in other assets, noncurrent Total cash, cash equivalents, and restricted cash $ $ $ $ $ $ $ $ $ The accompanying notes are an integral part of these consolidated financial statements. 1,070 159,552 15,344 1,422 $ $ $ $ $ 725 $ $ 283,134 48,647 2,301 334,082 $ $ 214 3,284 277 1,490 63,624 200 2,144 65,968 $ $ $ $ $ $ $ $ $ 133 392 212 175 36,146 675 36,821


