

Question
Answer the following questions: a) Obtain the standard deviations of idiosyncratic risk and variance-covariance matrix for these asset returns. b) Obtain your efficient portfolio in
Answer the following questions:
a) Obtain the standard deviations of idiosyncratic risk and variance-covariance matrix for these asset returns.
b) Obtain your efficient portfolio in allocations using Fisher Blacks method.
c) Using Solver in Excel to obtain the optimal portfolio using Treynors Ratio.
d) Are these two method having the same solutions? Why or why not?
e) Suppose your portfolio has initial value as $15 million and your confidence level for the portfolios performance is 95%. Let the asset returns be normally distributed, what is the VaR (Value at Risk) for your portfolio? What is the meaning of VaR? Is the normality assumption appropriate for the assessment of VaR?
f) Suppose that you change your portfolio by alternating infinitesimally small change on asset 4, what is the marginal VaR for this asset now?
g) What are the pros and cons in using VaR to specify the portfolio's risk?
h) If you'd like to increase $500,000 on both asset 1 and asset 4 your portfolio, what is the incremental VaR for your portfolio?
i) Suppose there is no such an index option available, what is the synthetic portfolio that you may want to construct if youd like to make sure that the maximum loss of your portfolio will not exceed the VaR you calculated in d)?
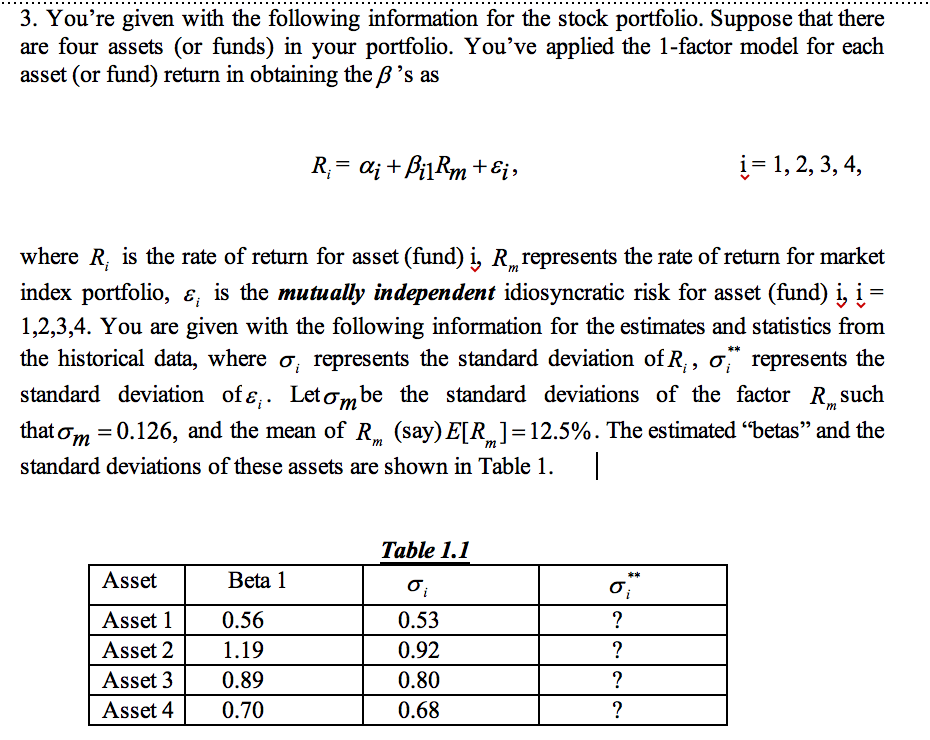
3. You're given with the following information for the stock portfolio. Suppose that there are four assets (or funds) in your portfolio. You've applied the 1-factor model for each asset (or fund) return in obtaining the B's as i- 1,2, 3,4, where R, is the rate of return for asset (fund) i, R represents the rate of return for market index portfolio, , is the mutually independent idiosyncratic risk for asset (fund) 1,2,3,4. You are given with the following information for the estimates and statistics from the historical data, where represents the standard deviation of R, ** represents the standard deviation ofi. Letm be the standard deviations of the factor Rm such that m 0.126, and the mean of Rm (say)EIR-12.5%. The estimated "betas" and the standard deviations of these assets are shown in Table 1 Table 1.1 Asset Beta 1 Asset10.56 Asset 21.19 Asset 30.89 Asset 4 0.70 0.53 0.92 0.80 0.68 3. You're given with the following information for the stock portfolio. Suppose that there are four assets (or funds) in your portfolio. You've applied the 1-factor model for each asset (or fund) return in obtaining the B's as i- 1,2, 3,4, where R, is the rate of return for asset (fund) i, R represents the rate of return for market index portfolio, , is the mutually independent idiosyncratic risk for asset (fund) 1,2,3,4. You are given with the following information for the estimates and statistics from the historical data, where represents the standard deviation of R, ** represents the standard deviation ofi. Letm be the standard deviations of the factor Rm such that m 0.126, and the mean of Rm (say)EIR-12.5%. The estimated "betas" and the standard deviations of these assets are shown in Table 1 Table 1.1 Asset Beta 1 Asset10.56 Asset 21.19 Asset 30.89 Asset 4 0.70 0.53 0.92 0.80 0.68Step by Step Solution
There are 3 Steps involved in it
Step: 1

Get Instant Access to Expert-Tailored Solutions
See step-by-step solutions with expert insights and AI powered tools for academic success
Step: 2

Step: 3
Ace Your Homework with AI
Get the answers you need in no time with our AI-driven, step-by-step assistance
Get Started
Monetary Policy And Public Finance
Authors: G. C. Hockley
1st Edition
1138704792, 978-1138704794