Question
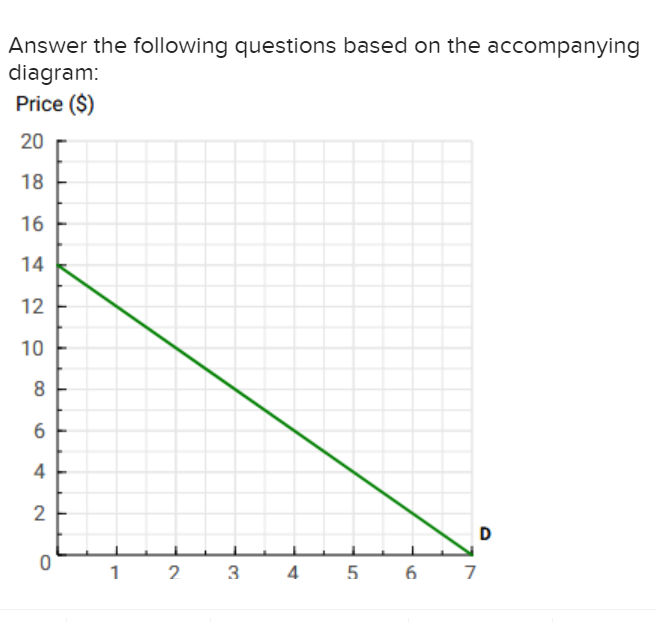
Answer the following questions based on the accompanying diagram: A graph plots the correlation between the quantity of a product and its price in dollars.
Answer the following questions based on the accompanying diagram: A graph plots the correlation between the quantity of a product and its price in dollars. The horizontal axis labeled quantity, ranges from 0 to 7 in increments of 1. The vertical axis labeled price in dollars, ranges from 0 to 20 in increments of 2. A line labeled D enters the quadrant through the point (0, 14) goes down to the right and exits the bottom right of the quadrant through the point (0, 7). Instructions: All dollar responses should be entered as whole numbers. Include a minus () sign for all negative answers.
a. How much would the firms revenue change if it lowered price from $12 to $8? Is demand elastic or inelastic in this range? Revenue change: $ Demand is (Click to select) in this range.
b. How much would the firms revenue change if it lowered price from $4 to $2? Is demand elastic or inelastic in this range? Revenue change: $ Demand is (Click to select) in this range.
c. What price maximizes the firms total revenues? What is the elasticity of demand at this point on the demand curve? Price that maximizes total revenues: $ Demand is (Click to select) at this point.
 Answer the following questions based on the accompanying diagram
 Step by Step Solution
There are 3 Steps involved in it
Step: 1

Get Instant Access to Expert-Tailored Solutions
See step-by-step solutions with expert insights and AI powered tools for academic success
Step: 2

Step: 3

Ace Your Homework with AI
Get the answers you need in no time with our AI-driven, step-by-step assistance
Get Started


