

Question
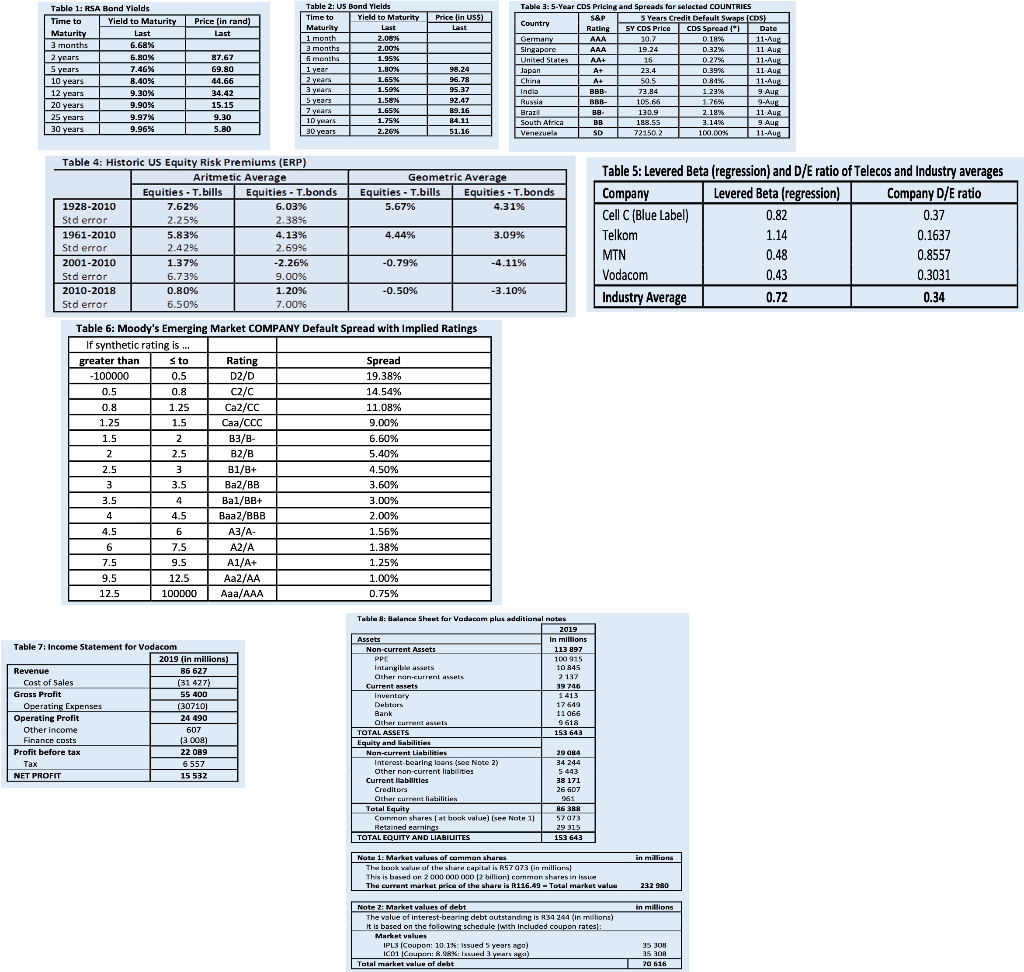
Answer the following questions by making use of the data provided in the Tables in order to calculate the weighted average cost of capital (WACC)
 Answer the following questions by making use of the data provided in the Tables in order to calculate
the weighted average cost of capital (WACC) of Vodacom, a leading telecommunications company in
South Africa.
Q 6.1 Calculate the cost of equity (Re) for Vodacom by answering questions 6.1 a to 6.1 f and referring
to the data provided in Tables 1 to 5 in this sheet
Q 6.1 a.) Use the data provided in Tables 1 to 4 to calculate the appropriate risk-free rate (RF) to
be used for Vodacom when calculating its cost of equity
Q 6.1 b.) Referring to the calculation in Q6.1 a. above, explain your reasoning in terms of the time
horizon chosen for the appropriate risk-free instrument and any adjustments made to
the risk-free rate
Q 6.1 c.) Use the data provided in Tables 1 to 4 to calculate the appropriate equity risk premium
(ERP) to be used for Vodacom when calculating its cost of equity (use historic ERP data
to derive your answer)
Q 6.1 d.) Identify and explain a single risk of using an historic ERP estimate when deriving a
current ERP for a company such as Vodacom
Q 6.1 e.) Table 5 contains data on the company and industry levered beta and debt/equity ratios.
Calculate the appropriate levered beta of Vodacom by making use of the bottom-up
approach. Assume a corporate tax rate of 28%
Q 6.1 f.) Make use of the calculated values above (Q6.1 a to Q6.1 e) to calculate the cost of
equity (Re) of Vodacom
Q 6.2 Use the data provided in Tables 6 to 8 to calculate the appropriate post-tax cost of debt (RD) to
be used for Vodacom when calculating its WACC. Assume a corporate tax rate of 28%
Q 6.3 Using the values calculated for Re and post-tax Rd in Q6.1 and Q6.2 above, along with the data
provided in Table 8, calculate the weighted average cost of capital (WACC) for Vodacom using
the MARKET VALUES of debt and equity. Assume that the company has no preference shares.
Please be aware of the NOTES added below Table 8)
Price in US$) Price (in rand) Last Table 2: US Bond Yields Time to Yield to Maturity Maturity 2.06% 2.00% Table 1: RSA Bond Yields Time to Yield to Maturity Maturity Last 3 months 6.68% 2 years 6.90% 5 years 7.46% 10 years 8.40% 12 years 9.30% 20 years 9.90% 25 years 9.97% 30 years 9.96% TOTIETTI 1,80X 99,24 96.78 95.37 87.67 69.80 44.66 34.42 15.15 9.30 5.80 Table 3: 5-Year CDS Pricing and Spreads for selected COUNTRIES S&P 5 Years Credit Default Swaps (CDS) Rating SY CDS Price CDS Spread Date 11-Aue AAA 19.24 0329 11 Aug 11-Aug 23.4 0.39% 11 Aug DB4% 11-Aug 72.94 1 235 9 Aug | BEP- TT 125 T9-Aug 2.18% 11 Aug 9 Aug SD 7 21502 100.00% 11-Aug 92.07 89.16 1.58% 1.65% 1.75% 2.26% 51.16 Geometric Average Equities - T.bills | Equities - T.bonds 5.67% 4.31% Table 4: Historic US Equity Risk Premiums (ERP) Aritmetic Average Equities - T.bills Equities - T.bonds 1928-2010 7.62% 6.03% Std error 2.25% 2.38% 1961-2010 5.83% 4.13% Std error 2.42% 2.69% 2001-2010 1.37% -2.26% Std error 6.73% 9.00% 2010-2018 0.80% 1.20% Std error 6.50% 7.00% 4.44% 3.09% Table 5: Levered Beta (regression) and D/E ratio of Telecos and Industry averages Company Levered Beta (regression) Company D/E ratio Cell C (Blue Label) 0.82 0.37 Telkom 1.14 0.1637 0.48 0.8557 Vodacom 0.43 0.3031 Industry Average 0.72 0.34 MTN -0.79% -4.11% -0.50% -3.10% 0.8 2 2.5 Table 6: Moody's Emerging Market COMPANY Default Spread with Implied Ratings If synthetic rating is ... greater than sto Rating Spread 100000 5 0. D 2/D 19.38% 0.5 C2/C 14.54% 0.8 1.25 Ca2/CC 11.08% 1.25 1.5 Caa/CCC 9.00% 1.5 B3/B 6.60% 2 B2/B 5.40% 2.5 B1/B+ 4.50% 3.5 Ba2/BB 3.60% Bal/BB+ 3.00% 4.5 Baa 2/BBB 2.00% 4.5 A3/A- 1.56% 7.5 A2/A 1.38% 7.5 9.5 A1/A+ 1.25% 9.5 12.5 Aa2/AA 1.00% 12.5 100000 Aaa/AAA 0.75% 6 Table 8: Balance Sheet for Vodacom plus additional notes 2019 113 897 100 915 10 845 2137 Other non current assets Current assets Table 7: Income Statement for Vodacom 2019 (in millions) Revenue 86 627 Cost of Sales (31 427) Gross Profit Operating Expenses 1307101 Operating Profit 24 490 Other Income Finance costs 13 008) Profit before tax 22 089 6557 NET PROFIT 15 532 1413 17 649 11 966 9 618 153 643 Other current Asses TOTAL ASSETS Equity and abilities Nan-current Liabilities Interest bearing loans (see Note 2) Other non-current liabilities Current liabilities 29 ORG 314 244 5443 38 171 26 607 Other current liabilities Total Equity Comman shares at book value) (see Note 1] 86 388 57 0173 29 315 153 643 TOTAL EQUITY AND LIABILITES in millions Nota 1: Market values of common shares The book value of the share capital is R57 073 (in millions! This is based on 2000 DODD 12 billion connan shares in issue The current market price of the share is R116.49 - Total market value 232 980 in millions Note Z: Market values of debt The value of interest-bearing debt outstanding is R34 244 (in millions) It is based on the following schedule with included coupon rates: Market values IPL3 (Coupon: 10.134: Issued 5 years ago) ICD1 Coupon R.ORK Issued 3 years aga) Total market value of debt 35 9 70 616 Price in US$) Price (in rand) Last Table 2: US Bond Yields Time to Yield to Maturity Maturity 2.06% 2.00% Table 1: RSA Bond Yields Time to Yield to Maturity Maturity Last 3 months 6.68% 2 years 6.90% 5 years 7.46% 10 years 8.40% 12 years 9.30% 20 years 9.90% 25 years 9.97% 30 years 9.96% TOTIETTI 1,80X 99,24 96.78 95.37 87.67 69.80 44.66 34.42 15.15 9.30 5.80 Table 3: 5-Year CDS Pricing and Spreads for selected COUNTRIES S&P 5 Years Credit Default Swaps (CDS) Rating SY CDS Price CDS Spread Date 11-Aue AAA 19.24 0329 11 Aug 11-Aug 23.4 0.39% 11 Aug DB4% 11-Aug 72.94 1 235 9 Aug | BEP- TT 125 T9-Aug 2.18% 11 Aug 9 Aug SD 7 21502 100.00% 11-Aug 92.07 89.16 1.58% 1.65% 1.75% 2.26% 51.16 Geometric Average Equities - T.bills | Equities - T.bonds 5.67% 4.31% Table 4: Historic US Equity Risk Premiums (ERP) Aritmetic Average Equities - T.bills Equities - T.bonds 1928-2010 7.62% 6.03% Std error 2.25% 2.38% 1961-2010 5.83% 4.13% Std error 2.42% 2.69% 2001-2010 1.37% -2.26% Std error 6.73% 9.00% 2010-2018 0.80% 1.20% Std error 6.50% 7.00% 4.44% 3.09% Table 5: Levered Beta (regression) and D/E ratio of Telecos and Industry averages Company Levered Beta (regression) Company D/E ratio Cell C (Blue Label) 0.82 0.37 Telkom 1.14 0.1637 0.48 0.8557 Vodacom 0.43 0.3031 Industry Average 0.72 0.34 MTN -0.79% -4.11% -0.50% -3.10% 0.8 2 2.5 Table 6: Moody's Emerging Market COMPANY Default Spread with Implied Ratings If synthetic rating is ... greater than sto Rating Spread 100000 5 0. D 2/D 19.38% 0.5 C2/C 14.54% 0.8 1.25 Ca2/CC 11.08% 1.25 1.5 Caa/CCC 9.00% 1.5 B3/B 6.60% 2 B2/B 5.40% 2.5 B1/B+ 4.50% 3.5 Ba2/BB 3.60% Bal/BB+ 3.00% 4.5 Baa 2/BBB 2.00% 4.5 A3/A- 1.56% 7.5 A2/A 1.38% 7.5 9.5 A1/A+ 1.25% 9.5 12.5 Aa2/AA 1.00% 12.5 100000 Aaa/AAA 0.75% 6 Table 8: Balance Sheet for Vodacom plus additional notes 2019 113 897 100 915 10 845 2137 Other non current assets Current assets Table 7: Income Statement for Vodacom 2019 (in millions) Revenue 86 627 Cost of Sales (31 427) Gross Profit Operating Expenses 1307101 Operating Profit 24 490 Other Income Finance costs 13 008) Profit before tax 22 089 6557 NET PROFIT 15 532 1413 17 649 11 966 9 618 153 643 Other current Asses TOTAL ASSETS Equity and abilities Nan-current Liabilities Interest bearing loans (see Note 2) Other non-current liabilities Current liabilities 29 ORG 314 244 5443 38 171 26 607 Other current liabilities Total Equity Comman shares at book value) (see Note 1] 86 388 57 0173 29 315 153 643 TOTAL EQUITY AND LIABILITES in millions Nota 1: Market values of common shares The book value of the share capital is R57 073 (in millions! This is based on 2000 DODD 12 billion connan shares in issue The current market price of the share is R116.49 - Total market value 232 980 in millions Note Z: Market values of debt The value of interest-bearing debt outstanding is R34 244 (in millions) It is based on the following schedule with included coupon rates: Market values IPL3 (Coupon: 10.134: Issued 5 years ago) ICD1 Coupon R.ORK Issued 3 years aga) Total market value of debt 35 9 70 616
Step by Step Solution
There are 3 Steps involved in it
Step: 1

Get Instant Access to Expert-Tailored Solutions
See step-by-step solutions with expert insights and AI powered tools for academic success
Step: 2

Step: 3
Ace Your Homework with AI
Get the answers you need in no time with our AI-driven, step-by-step assistance
Get Started
Financial Accounting Essentials You Always Wanted To Know Self Learning Management Series
Authors: Vibrant Publishers , Kalpesh Ashar
5th Edition
1636510973, 978-1636510972