Answer the following questions:
- How does your estimate of beta compare with the beta published by Yahoo? Why might it differ from Yahoos published beta?
- How much of the variability of your securitys return is explained by the variability of returns in the market? (Note: In your case, the market is represented by the S&P 500 Index.) Do you think that a different market index might be a better representation of the market for your particular security? Why/Why not?
- What is the correlation of returns for your security with the market for the selected time period? Might this relationship change over time, and if so, how and why?
- Does the relationship between your security and the market appear to be statistically significantly different than zero? What evidence from the regression supports your conclusion?
- Review the standardized residuals and comment about the importance of individual data points (if any) that may have influenced your estimation of beta.
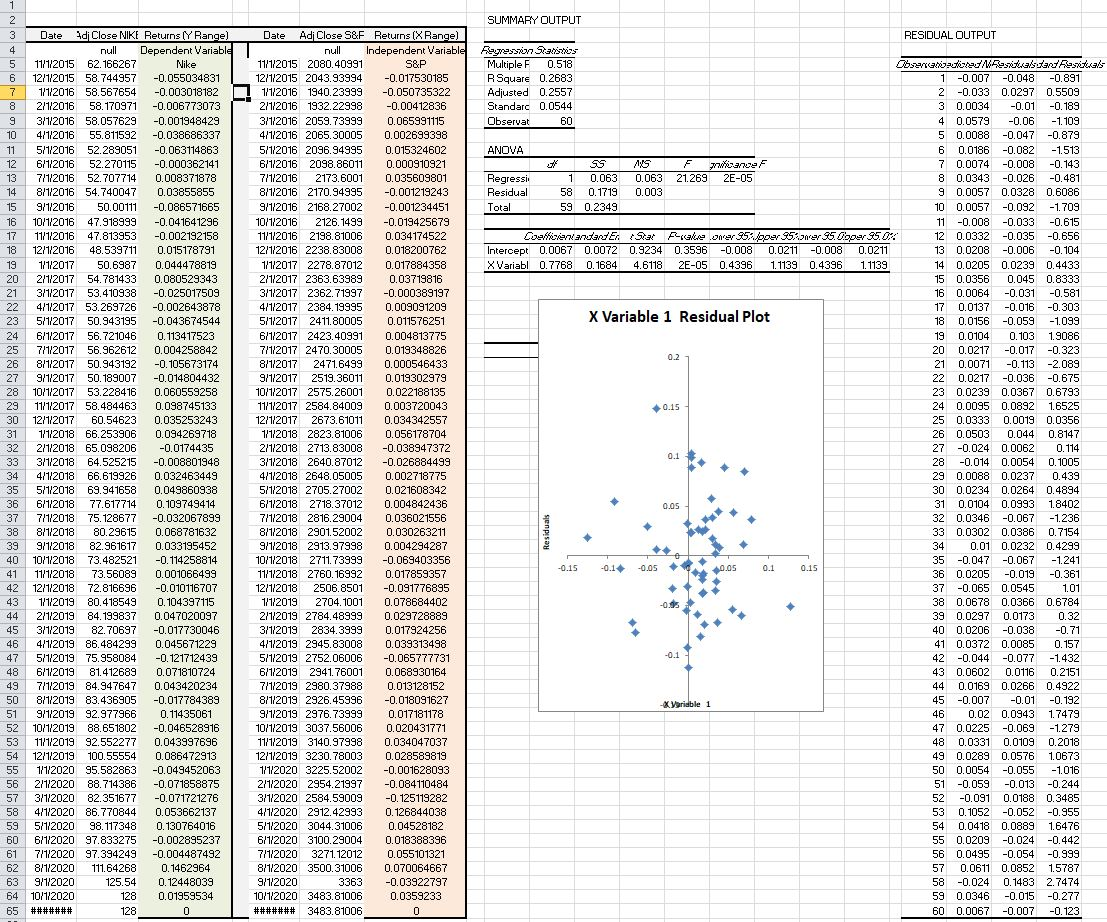
1 2 3 4 5 6 7 8 9 9 10 0.15 Date di Close NIKE Returns (Y Range) null Dependent Variable 11/1/2015 62. 166267 Nike 12/1/2015 58.744957 -0.055034831 1/1/2016 58.567654 -0.003018182 2/1/2016 58.170971 -0.006773073 3/1/2016 58.057629 -0.001948429 4/1/2016 55.811592 -0.038686337 5/1/2016 52.289051 -0.063114863 6/1/2016 52.270115 -0.000362141 7/1/2016 52.707714 0.008371878 8/1/2016 54.740047 0.03855855 9/1/2016 50.00111 -0.086571665 10/1/2016 47.918999 -0.041641296 11/1/2016 47.813953 -0.002192158 12/1/2016 48.539711 0.015178791 1/1/2017 50.6987 0.044478819 2/1/2017 54.781433 0.080529343 311/2017 53.410938 -0.025017509 4/1/2017 53.269726 -0.002643878 5/1/2017 50.943195 -0.043674544 6/1/2017 56.721046 0.113417523 7/1/2017 56.962612 0.004258842 811/2017 50.943192 -0.105673174 9/1/2017 50.189007 -0.014804432 10/1/2017 53.228416 0.060559258 11/1/2017 58.484463 0.098745133 12/1/2017 60.54623 0.035253243 1/1/2018 66.253906 0.094269718 2/1/2018 65.098206 -0.0174435 3/1/2018 64.525215 -0.008801948 66.619926 0.032463449 5/1/2018 69.941658 0.049860938 6/1/2018 77.617714 0.109749414 7/1/2018 75. 128677 -0.032067899 8/1/2018 80.29615 0.068781632 9/1/2018 82.961617 0.033195452 10/1/2018 73.482521 -0.114258814 11/1/2018 73.56089 0.001066499 12/1/2018 72.816696 -0.010116707 1/1/2019 80.418549 0.104397115 2/1/2019 84.199837 0.047020097 3/1/2019 82.70697 -0.017730046 4/1/2019 86.484299 0.045671229 5/1/2019 75.958084 -0.121712439 6/1/2019 81.412689 0.071810724 7/1/2019 84.947647 0.043420234 8/1/2019 83.436905 -0.017784389 9/1/2019 92.977966 0.11435061 10/1/2019 88.651802 -0.046528916 11/1/2019 92.552277 0.043997696 12/1/2019 100.55554 0.086472913 1/1/2020 95.582863 -0.049452063 2/1/2020 88.714386 -0.071858875 3/1/2020 82.351677 -0.071721276 4/1/2020 86.770844 0.053662137 5/1/2020 98. 117348 0.130764016 6/1/2020 97.833275 -0.002895237 7/1/2020 97.394249 -0.004487492 8/1/2020 111.64268 0.1462964 9/1/2020 125.54 0.12448039 10/1/2020 128 0.01959534 ####### 128 0 11 12 13 14 15 16 17 18 19 20 21 22 23 24 25 26 27 28 29 30 31 32 33 34 35 36 37 38 39 40 41 42 43 44 45 46 47 48 49 50 51 52 53 54 55 56 57 58 59 60 61 62 63 64 65 4/1/2018 SUMMARY OUTPUT RESIDUAL OUTPUT Ayvan Tanzhes Multiple F 0.518 Leonatordarsuadranatars R Square 0.2683 1 -0.007 -0.048 -0.891 Adjusted 0.2557 2 -0.033 0.0297 0.5509 Standard 0.0544 3 0.0034 -0.01 -0.189 Observat 60 4 0.0579 -0.06 -1.109 5 0.0088 -0.047 -0.879 ANOVA 6 0.0186 -0.082 -1.513 F wanden 7 0.0074 -0.008 -0.143 Regressi 1 1 0.063 0.063 21.269 2E-05 8 0.0343 -0.026 -0.481 Residual 58 0.1719 0.003 9 0.0057 0.0328 0.6086 Total 59 0.2349 10 0.0057 -0.092 -1.709 11 -0.008 -0.033 -0.615 Cookie aderter Rat Pretener 552.bper 5521er 95. Gigger 95.0% 12 0.0332 -0.035 -0.656 Intercept 0.0067 0.0072 0.9234 0.3596 -0.008 0.0211 -0.008 0.0211 13 0.0208 -0.006 -0.104 X Variabl 0.7768 0.1684 4.6118 2E-05 0.4396 1.1139 0.4396 1.1139 14 0.0205 0.0239 0.4433 15 0.0356 0.045 0.8333 16 0.0064 -0.031 -0.581 17 0.0137 -0.016 -0.303 X Variable 1 Residual Plot 18 0.0156 -0.059 -1.099 19 0.0104 0.103 1.9086 20 0.0217 0.2 -0.017 -0.323 21 0.0071 -0.113 -2.089 22 0.0217 -0.036 -0.675 23 0.0239 0.0367 0.6793 24 0.0095 0.0892 1.6525 25 0.0333 0.0019 0.0356 26 0.0503 0.044 0.8147 27 -0.024 0.0062 0.114 0.1 28 -0.014 0.0054 0.10 0.1005 29 0.0088 0.0237 0.439 30 0.0234 0.0264 0.4894 0.05 31 0.0104 0.0993 1.8402 32 0.0346 -0.067 -1.236 33 0.0302 0.0386 0.7154 34 0.01 0.0232 0.4299 35 -0.047 -0.067 -0.15 -0.05 -1.241 0.05 0.1 0.15 36 0.0205 -0.019 -0.361 37 -0.065 0.0545 1.01 38 0.0678 0.0366 0.6784 39 0.0297 0.0173 0.32 40 0.0206 -0.038 -0.71 41 0.0372 0.0085 0.157 -0.1 42 -0.044 -0.077 -1.432 43 0.0602 0.0116 0.2151 44 0.0169 0.0266 0.4922 Xaridble 1 45 -0.007 -0.01 -0.192 46 0.02 0.0943 1.7479 47 0.0225 -0.069 -1.279 48 0.0331 0.0109 0.2018 49 0.0289 0.0576 1.0673 50 0.0054 -0.055 -1.016 51 -0.059 -0.013 -0.244 52 -0.091 0.0188 0.3485 53 0.1052 -0.052 -0.955 54 0.0418 0.0889 1.6476 55 0.0209 -0.024 -0.442 56 0.0495 -0.054 -0.999 57 0.0611 0.0852 1.5787 58 -0.024 0.1483 2.7474 59 0.0346 -0.015 -0.277 60 0.0067 -0.007 -0.123 Date Adi Close S&F Returns (X Range) null Independent Variable 11/1/2015 2080.40991 S&P 12/1/2015 2043.93994 -0.017530185 1/1/2016 1940.23999 -0.050735322 2/1/2016 1932.22998 -0.00412836 3/1/2016 2059.73999 0.065991115 4/1/2016 2065.30005 0.002699398 5/1/2016 2096.94995 0.015324602 6/1/2016 2098.86011 0.000910921 7/1/2016 2173.6001 0.035609801 8/1/2016 2170.94995 -0.001219243 9/1/2016 2168.27002 -0.001234451 10/1/2016 2126.1499 -0.019425679 11/1/2016 2198.81006 0.034174522 12/1/2016 2238.83008 0.018200762 1/1/2017 2278.87012 0.017884358 2/1/2017 2363.63989 0.03719816 3/1/2017 2362.71997 -0.000389197 4/1/2017 2384. 19995 0.009091209 5/1/2017 2411.80005 0.011576251 6/1/2017 2423.40991 0.004813775 7/1/2017 2470.30005 0.019348826 8/1/2017 2471.6499 0.000546433 9/1/2017 2519.36011 0.019302979 10/1/2017 2575.26001 0.022188135 11/1/2017 2584.84009 0.003720043 12/1/2017 2673.61011 0.034342557 1/1/2018 2823.81006 0.056178704 2/1/2018 2713.83008 -0.038947372 3/1/2018 2640.87012 -0.026884499 4/1/2018 2648.05005 0.002718775 5/1/2018 2705.27002 0.021608342 6/1/2018 2718.37012 0.004842436 7/1/2018 2816.29004 0.036021556 8/1/2018 2901.52002 0.030263211 9/1/2018 2913.97998 0.004294287 10/1/2018 2711.73999 -0.069403356 11/1/2018 2760.16992 0.017859357 12/1/2018 2506.8501 -0.091776895 1/1/2019 2704.1001 0.078684402 2/1/2019 2784.48999 0.029728889 3/1/2019 2834.3999 0.017924256 4/1/2019 2945.83008 0.039313498 5/1/2019 2752.06006 -0.065777731 6/1/2019 2941.76001 0.068930164 7/1/2019 2980.37988 0.013128152 8/1/2019 2926.45996 -0.018091627 9/1/2019 2976.73999 0.017181178 10/1/2019 3037.56006 0.020431771 11/1/2019 3140.97998 0.034047037 12/1/2019 3230.78003 0.028589819 1/1/2020 3225.52002 -0.001628093 2/1/2020 2954.21997 -0.084110484 3/1/2020 2584.59009 -0.125119282 4/1/2020 2912.42993 0.126844038 5/1/2020 3044.31006 0.04528182 6/1/2020 3100.29004 0.018388396 7/1/2020 3271.12012 0.055101321 8/1/2020 3500. 31006 0.070064667 9/1/2020 3363 -0.03922797 10/1/2020 3483.81006 0.0359233 ####### 3483.81006 0 1 2 3 4 5 6 7 8 9 9 10 0.15 Date di Close NIKE Returns (Y Range) null Dependent Variable 11/1/2015 62. 166267 Nike 12/1/2015 58.744957 -0.055034831 1/1/2016 58.567654 -0.003018182 2/1/2016 58.170971 -0.006773073 3/1/2016 58.057629 -0.001948429 4/1/2016 55.811592 -0.038686337 5/1/2016 52.289051 -0.063114863 6/1/2016 52.270115 -0.000362141 7/1/2016 52.707714 0.008371878 8/1/2016 54.740047 0.03855855 9/1/2016 50.00111 -0.086571665 10/1/2016 47.918999 -0.041641296 11/1/2016 47.813953 -0.002192158 12/1/2016 48.539711 0.015178791 1/1/2017 50.6987 0.044478819 2/1/2017 54.781433 0.080529343 311/2017 53.410938 -0.025017509 4/1/2017 53.269726 -0.002643878 5/1/2017 50.943195 -0.043674544 6/1/2017 56.721046 0.113417523 7/1/2017 56.962612 0.004258842 811/2017 50.943192 -0.105673174 9/1/2017 50.189007 -0.014804432 10/1/2017 53.228416 0.060559258 11/1/2017 58.484463 0.098745133 12/1/2017 60.54623 0.035253243 1/1/2018 66.253906 0.094269718 2/1/2018 65.098206 -0.0174435 3/1/2018 64.525215 -0.008801948 66.619926 0.032463449 5/1/2018 69.941658 0.049860938 6/1/2018 77.617714 0.109749414 7/1/2018 75. 128677 -0.032067899 8/1/2018 80.29615 0.068781632 9/1/2018 82.961617 0.033195452 10/1/2018 73.482521 -0.114258814 11/1/2018 73.56089 0.001066499 12/1/2018 72.816696 -0.010116707 1/1/2019 80.418549 0.104397115 2/1/2019 84.199837 0.047020097 3/1/2019 82.70697 -0.017730046 4/1/2019 86.484299 0.045671229 5/1/2019 75.958084 -0.121712439 6/1/2019 81.412689 0.071810724 7/1/2019 84.947647 0.043420234 8/1/2019 83.436905 -0.017784389 9/1/2019 92.977966 0.11435061 10/1/2019 88.651802 -0.046528916 11/1/2019 92.552277 0.043997696 12/1/2019 100.55554 0.086472913 1/1/2020 95.582863 -0.049452063 2/1/2020 88.714386 -0.071858875 3/1/2020 82.351677 -0.071721276 4/1/2020 86.770844 0.053662137 5/1/2020 98. 117348 0.130764016 6/1/2020 97.833275 -0.002895237 7/1/2020 97.394249 -0.004487492 8/1/2020 111.64268 0.1462964 9/1/2020 125.54 0.12448039 10/1/2020 128 0.01959534 ####### 128 0 11 12 13 14 15 16 17 18 19 20 21 22 23 24 25 26 27 28 29 30 31 32 33 34 35 36 37 38 39 40 41 42 43 44 45 46 47 48 49 50 51 52 53 54 55 56 57 58 59 60 61 62 63 64 65 4/1/2018 SUMMARY OUTPUT RESIDUAL OUTPUT Ayvan Tanzhes Multiple F 0.518 Leonatordarsuadranatars R Square 0.2683 1 -0.007 -0.048 -0.891 Adjusted 0.2557 2 -0.033 0.0297 0.5509 Standard 0.0544 3 0.0034 -0.01 -0.189 Observat 60 4 0.0579 -0.06 -1.109 5 0.0088 -0.047 -0.879 ANOVA 6 0.0186 -0.082 -1.513 F wanden 7 0.0074 -0.008 -0.143 Regressi 1 1 0.063 0.063 21.269 2E-05 8 0.0343 -0.026 -0.481 Residual 58 0.1719 0.003 9 0.0057 0.0328 0.6086 Total 59 0.2349 10 0.0057 -0.092 -1.709 11 -0.008 -0.033 -0.615 Cookie aderter Rat Pretener 552.bper 5521er 95. Gigger 95.0% 12 0.0332 -0.035 -0.656 Intercept 0.0067 0.0072 0.9234 0.3596 -0.008 0.0211 -0.008 0.0211 13 0.0208 -0.006 -0.104 X Variabl 0.7768 0.1684 4.6118 2E-05 0.4396 1.1139 0.4396 1.1139 14 0.0205 0.0239 0.4433 15 0.0356 0.045 0.8333 16 0.0064 -0.031 -0.581 17 0.0137 -0.016 -0.303 X Variable 1 Residual Plot 18 0.0156 -0.059 -1.099 19 0.0104 0.103 1.9086 20 0.0217 0.2 -0.017 -0.323 21 0.0071 -0.113 -2.089 22 0.0217 -0.036 -0.675 23 0.0239 0.0367 0.6793 24 0.0095 0.0892 1.6525 25 0.0333 0.0019 0.0356 26 0.0503 0.044 0.8147 27 -0.024 0.0062 0.114 0.1 28 -0.014 0.0054 0.10 0.1005 29 0.0088 0.0237 0.439 30 0.0234 0.0264 0.4894 0.05 31 0.0104 0.0993 1.8402 32 0.0346 -0.067 -1.236 33 0.0302 0.0386 0.7154 34 0.01 0.0232 0.4299 35 -0.047 -0.067 -0.15 -0.05 -1.241 0.05 0.1 0.15 36 0.0205 -0.019 -0.361 37 -0.065 0.0545 1.01 38 0.0678 0.0366 0.6784 39 0.0297 0.0173 0.32 40 0.0206 -0.038 -0.71 41 0.0372 0.0085 0.157 -0.1 42 -0.044 -0.077 -1.432 43 0.0602 0.0116 0.2151 44 0.0169 0.0266 0.4922 Xaridble 1 45 -0.007 -0.01 -0.192 46 0.02 0.0943 1.7479 47 0.0225 -0.069 -1.279 48 0.0331 0.0109 0.2018 49 0.0289 0.0576 1.0673 50 0.0054 -0.055 -1.016 51 -0.059 -0.013 -0.244 52 -0.091 0.0188 0.3485 53 0.1052 -0.052 -0.955 54 0.0418 0.0889 1.6476 55 0.0209 -0.024 -0.442 56 0.0495 -0.054 -0.999 57 0.0611 0.0852 1.5787 58 -0.024 0.1483 2.7474 59 0.0346 -0.015 -0.277 60 0.0067 -0.007 -0.123 Date Adi Close S&F Returns (X Range) null Independent Variable 11/1/2015 2080.40991 S&P 12/1/2015 2043.93994 -0.017530185 1/1/2016 1940.23999 -0.050735322 2/1/2016 1932.22998 -0.00412836 3/1/2016 2059.73999 0.065991115 4/1/2016 2065.30005 0.002699398 5/1/2016 2096.94995 0.015324602 6/1/2016 2098.86011 0.000910921 7/1/2016 2173.6001 0.035609801 8/1/2016 2170.94995 -0.001219243 9/1/2016 2168.27002 -0.001234451 10/1/2016 2126.1499 -0.019425679 11/1/2016 2198.81006 0.034174522 12/1/2016 2238.83008 0.018200762 1/1/2017 2278.87012 0.017884358 2/1/2017 2363.63989 0.03719816 3/1/2017 2362.71997 -0.000389197 4/1/2017 2384. 19995 0.009091209 5/1/2017 2411.80005 0.011576251 6/1/2017 2423.40991 0.004813775 7/1/2017 2470.30005 0.019348826 8/1/2017 2471.6499 0.000546433 9/1/2017 2519.36011 0.019302979 10/1/2017 2575.26001 0.022188135 11/1/2017 2584.84009 0.003720043 12/1/2017 2673.61011 0.034342557 1/1/2018 2823.81006 0.056178704 2/1/2018 2713.83008 -0.038947372 3/1/2018 2640.87012 -0.026884499 4/1/2018 2648.05005 0.002718775 5/1/2018 2705.27002 0.021608342 6/1/2018 2718.37012 0.004842436 7/1/2018 2816.29004 0.036021556 8/1/2018 2901.52002 0.030263211 9/1/2018 2913.97998 0.004294287 10/1/2018 2711.73999 -0.069403356 11/1/2018 2760.16992 0.017859357 12/1/2018 2506.8501 -0.091776895 1/1/2019 2704.1001 0.078684402 2/1/2019 2784.48999 0.029728889 3/1/2019 2834.3999 0.017924256 4/1/2019 2945.83008 0.039313498 5/1/2019 2752.06006 -0.065777731 6/1/2019 2941.76001 0.068930164 7/1/2019 2980.37988 0.013128152 8/1/2019 2926.45996 -0.018091627 9/1/2019 2976.73999 0.017181178 10/1/2019 3037.56006 0.020431771 11/1/2019 3140.97998 0.034047037 12/1/2019 3230.78003 0.028589819 1/1/2020 3225.52002 -0.001628093 2/1/2020 2954.21997 -0.084110484 3/1/2020 2584.59009 -0.125119282 4/1/2020 2912.42993 0.126844038 5/1/2020 3044.31006 0.04528182 6/1/2020 3100.29004 0.018388396 7/1/2020 3271.12012 0.055101321 8/1/2020 3500. 31006 0.070064667 9/1/2020 3363 -0.03922797 10/1/2020 3483.81006 0.0359233 ####### 3483.81006 0