

Question
Answer the following questions showing all work.No credit will be given to answers without work shown. If you use Minitab Express or StatKey include the
Answer the following questions showing all work.No credit will be given to answers without work shown. If you use Minitab Express or StatKey include the appropriate output (copy + paste). If you do hand calculations show your work using the Word equation editor. Clearly identify your final answers. Output without explanation will not receive any credit and answers with no output or explanation will not receive any credit. Round all answers to 3 decimal places. If you have any questions, post them to the course discussion board.
1. Use the file BaseballTimes.MTW to answer the following questions.These data were collected from a sample of Major League Baseball games. We are going to be using the Runs variable which is the total number of runs scored by both teams and the Time variable which is the length of the game in minutes.
A. Create scatterplot with time on the X-axis and runs on the Y-axis.
B. Use the five-step hypothesis testing procedure to determine if there is a statistically significant relationship between time and runs.(Use Pearson's r and Minitab Express)
Step 1:
Step 2:
Step 3:
Step 4:
Step 5:
C. Use the five-step hypothesis testing procedure to determine if time is a statistically significant predictor of runs. In other words, test for the significance of the slope in the simple linear regression model. Use Minitab Express.Don't forget to check all of the assumptions!
Step 1:
Step 2:
Step 3:
Step 4:
Step 5:
D. Use the five-step hypothesis testing procedure to determine if runs is a statistically significant predictor of time. All assumptions have been met.
Step 1:
Step 2:
Step 3:
Step 4:
Step 5:
E. How was the regression model impacted when the X and Y variables were switched? Compare the slope, y-intercept, p-values, and r-squared values for the models you tested in parts C and D.
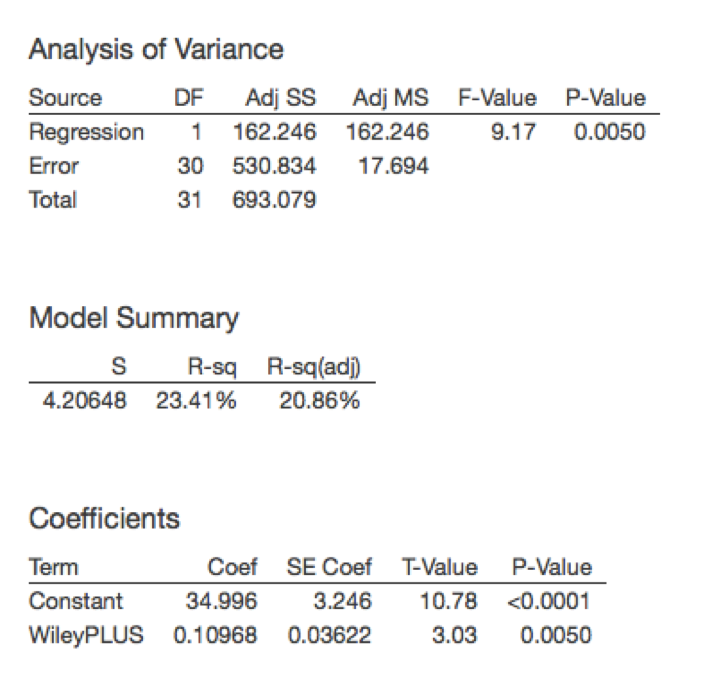
2. Data were collected from a sample of World Campus STAT200 students from the Summer 2017 semester. We want to know if there is a relationship between students' WileyPLUS scores (out of 100 points) and scores on the midterm exam (out of 50 points) in the population of all World Campus STAT200 students.All assumptions were checked and were met for using linear regression techniques. The following output was obtained from Minitab Express for a simple linear regression model using WileyPLUS scores to predict midterm exam scores.
A. What is the correlation (Pearson's r) between WileyPLUS and midterm exam scores in this sample?
B. Is the correlation between WileyPLUS and midterm exam scores statistically significant? Explain how you know this.
C. If a student has a WileyPLUS score of 85, what is this student's predicted midterm exam score?
Step by Step Solution
There are 3 Steps involved in it
Step: 1

Get Instant Access to Expert-Tailored Solutions
See step-by-step solutions with expert insights and AI powered tools for academic success
Step: 2

Step: 3
Ace Your Homework with AI
Get the answers you need in no time with our AI-driven, step-by-step assistance
Get Started
College Algebra Graphs and Models
Authors: Marvin L. Bittinger, Judith A. Beecher, David J. Ellenbogen, Judith A. Penna
5th edition
321845404, 978-0321791009, 321791002, 978-0321783950, 321783956, 978-0321845405