Answered step by step
Verified Expert Solution
Question
1 Approved Answer
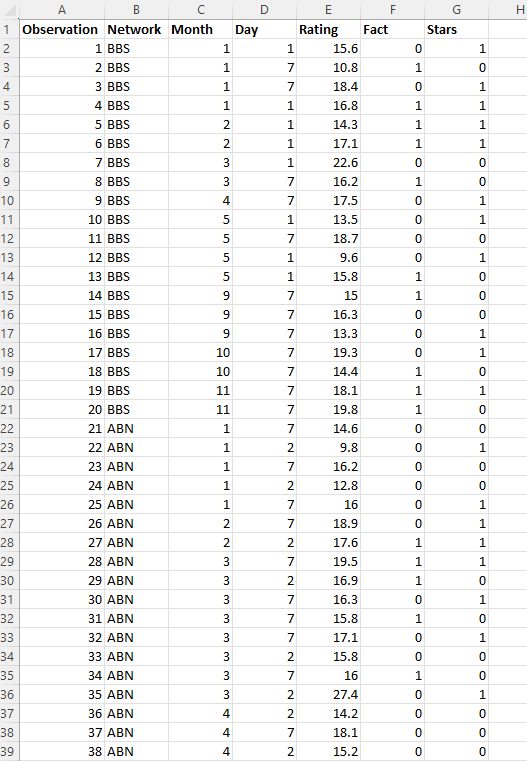
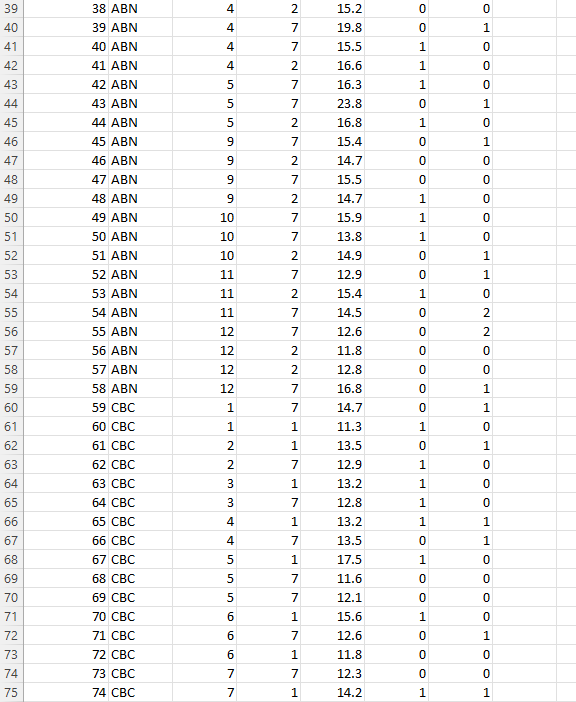
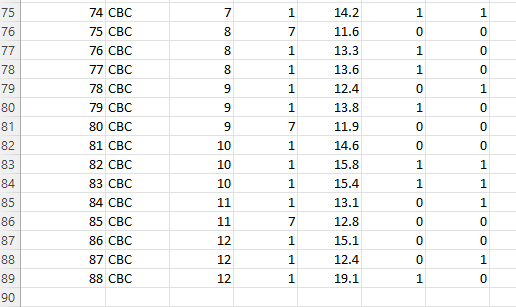
Answer the following questions: What is the average rating for all CBC movies? How about ABN movies and BBS movies? Provide a bar chart that
- Answer the following questions:
- What is the average rating for all CBC movies? How about ABN movies and BBS movies? Provide a bar chart that compares these averages.
- Include a table that shows the descriptive statistics using the data analysis tool pack in Excel for the ratings of the three networks (one column for each network).
- Comment on how the networks are performing, by comparing and interpreting the metrics in the descriptive statistics table. Your analysis must extend beyond simply comparing the average ratings for each network.
- a scatter graph of the monthly average ratings for CBC for the year. Note that there are multiple ratings data for the months; you will need to calculate an average for each month first, and then plot the averages. After you create the graph, fit a linear trend line and a 2nd order polynomial trend line, displaying the formula and the r-squared. Explain to the executives if you can use this time series data to forecast the ratings of upcoming months. Which forecasting method is better? How accurate can you expect this forecast to be?
- The executives wish to know if they should hire stars for their programs. To answer this question, run a hypothesis test to see if the ratings of shows with stars are higher compared to those without stars. Use the data for CBC movies only. Use 95% confidence.
- Run a multiple regression where the dependent variable is ratings and the independent variables are star and fact. Use data from CBC only. CBC Management has several questions:
- Executives wish to know how much being fact-based or having one star contributes to a movies rating. What can you tell them about this?
- Are either, both, or neither of the independent variables significantly related to the ratings at 95% confidence? Justify your answers referring to the relevant figures.
- How well does this regression analysis explain the ratings? Should the executives count on the results from this analysis? Justify your answers referring to the relevant figures.


Step by Step Solution
There are 3 Steps involved in it
Step: 1

Get Instant Access to Expert-Tailored Solutions
See step-by-step solutions with expert insights and AI powered tools for academic success
Step: 2

Step: 3

Ace Your Homework with AI
Get the answers you need in no time with our AI-driven, step-by-step assistance
Get Started


