Answered step by step
Verified Expert Solution
Question
1 Approved Answer
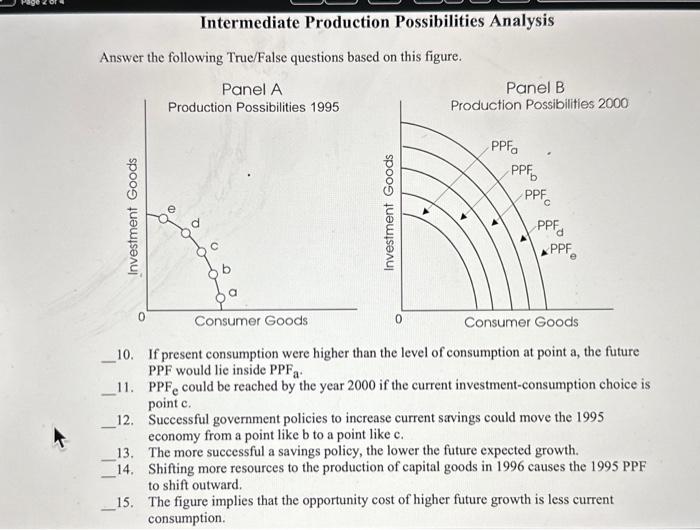
Answer the following True/False questions based on this figure. Investment Goods Intermediate Production Possibilities Analysis 0 Panel A Production Possibilities 1995 Investment Goods 0


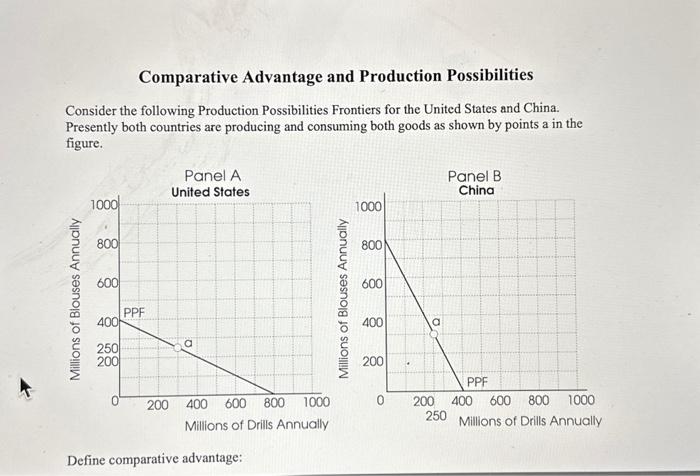
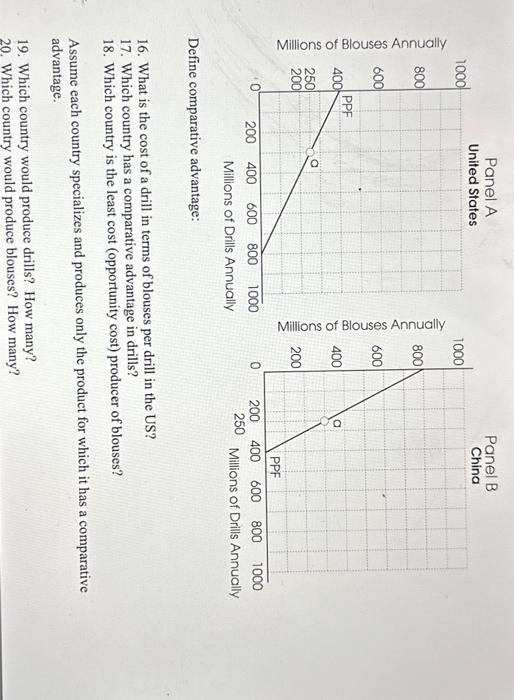
Answer the following True/False questions based on this figure. Investment Goods Intermediate Production Possibilities Analysis 0 Panel A Production Possibilities 1995 Investment Goods 0 Panel B Production Possibilities 2000 PPF PPF PPFC PPF PPFe Consumer Goods Consumer Goods 10. If present consumption were higher than the level of consumption at point a, the future PPF would lie inside PPFa 11. PPF could be reached by the year 2000 if the current investment-consumption choice is point c. 12. Successful government policies to increase current savings could move the 1995 economy from a point like b to a point like c. 13. The more successful a savings policy, the lower the future expected growth. 14. Shifting more resources to the production of capital goods in 1996 causes the 1995 PPF to shift outward. 15. The figure implies that the opportunity cost of higher future growth is less current consumption. Comparative Advantage and Production Possibilities Consider the following Production Possibilities Frontiers for the United States and China. Presently both countries are producing and consuming both goods as shown by points a in the figure. Millions of Blouses Annually 1000 800 600 400 250 200 PPF Panel A United States 200 400 600 800 1000 Millions of Drills Annually Define comparative advantage: Millions of Blouses Annually 1000 800 600 400 200 0 a 200 250 Panel B China PPF 400 600 800 1000 Millions of Drills Annually Millions of Blouses Annually 1000 800 600 400 250 200 PPF Panel A United States O 200 400 600 800 1000 Millions of Drills Annually Define comparative advantage: Millions of Blouses Annually 1000 800 600 400 200 0 a 200 19. Which country would produce drills? How many? 20. Which country would produce blouses? How many? 250 Panel B China PPF 400 600 1000 800 Millions of Drills Annually 16. What is the cost of a drill in terms of blouses per drill in the US? 17. Which country has a comparative advantage in drills? 18. Which country is the least cost (opportunity cost) producer of blouses? Assume each country specializes and produces only the product for which it has a comparative advantage.
Step by Step Solution
★★★★★
3.40 Rating (156 Votes )
There are 3 Steps involved in it
Step: 1
The cost of a drill in terms of blouses per drill in the US can be determined by the slope of the pr...
Get Instant Access to Expert-Tailored Solutions
See step-by-step solutions with expert insights and AI powered tools for academic success
Step: 2

Step: 3

Ace Your Homework with AI
Get the answers you need in no time with our AI-driven, step-by-step assistance
Get Started


