Answer the following using the R statistical computing platform. Please should include the code you wrote plus the output of such code and English rhetoric / coding comments where necessary.
Question
Using the "accept-reject" algorithm, generate observations from the binomial distribution as target distribution and the uniform distribution as proposal distribution. Reverse the roles and carry out the same simulation and note the differences.
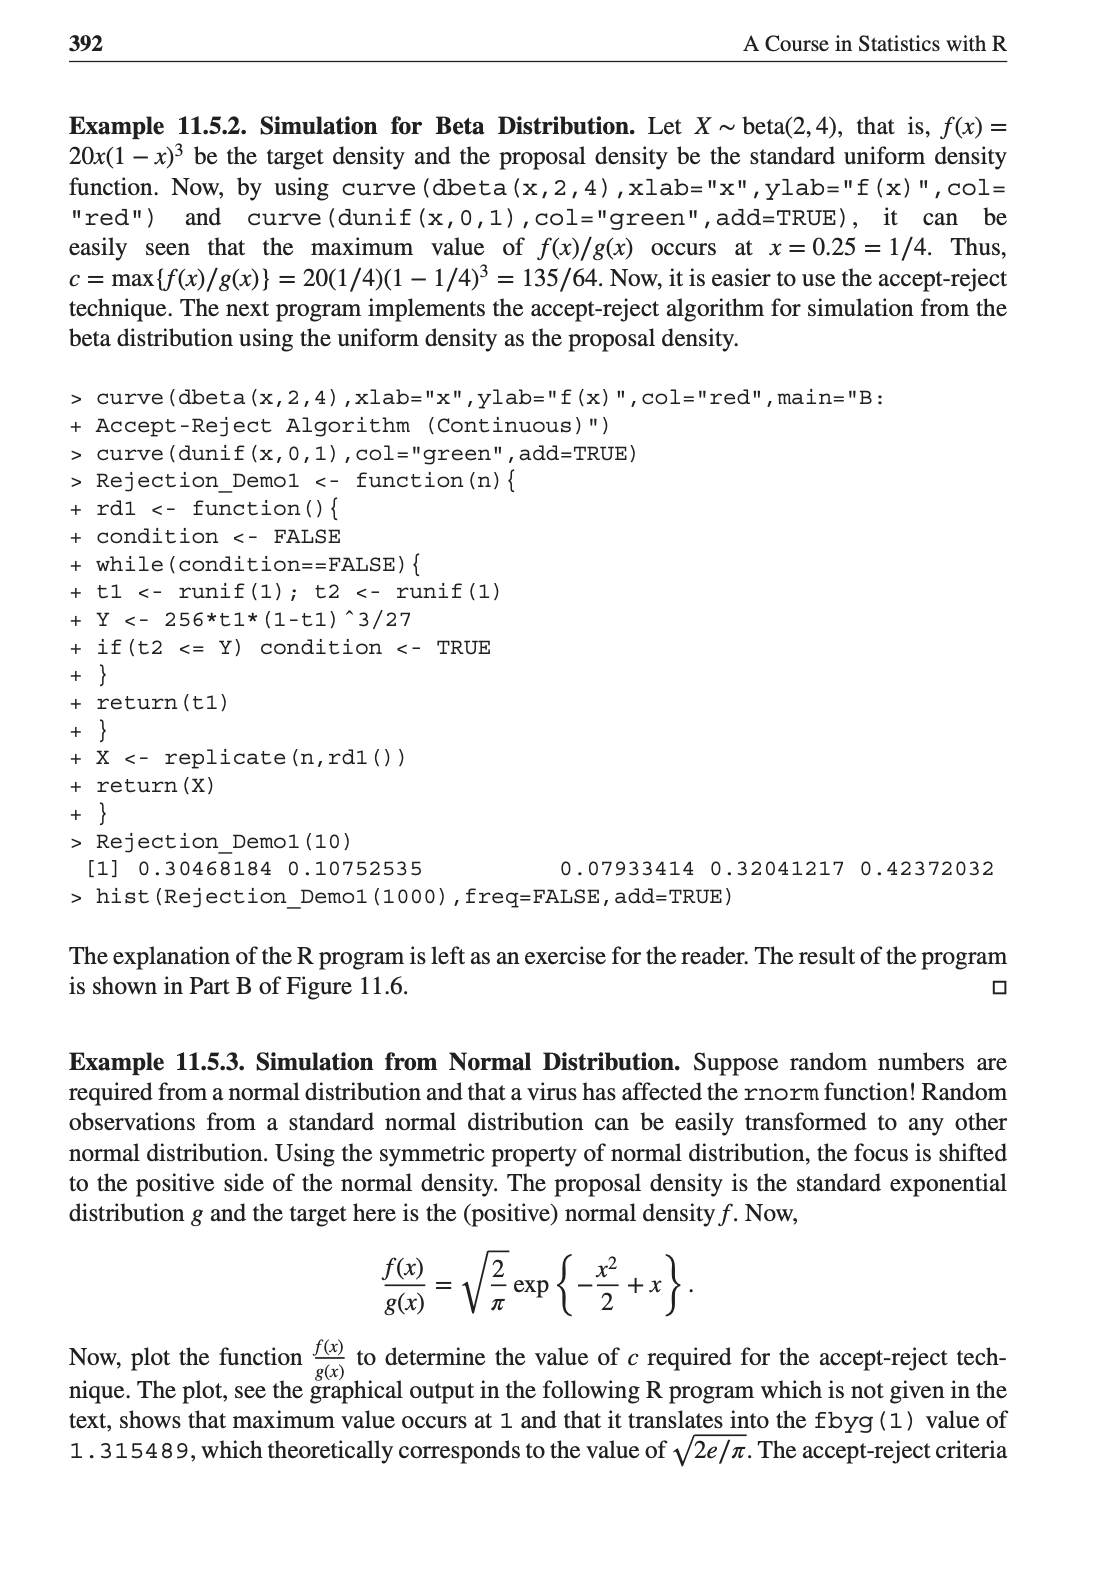
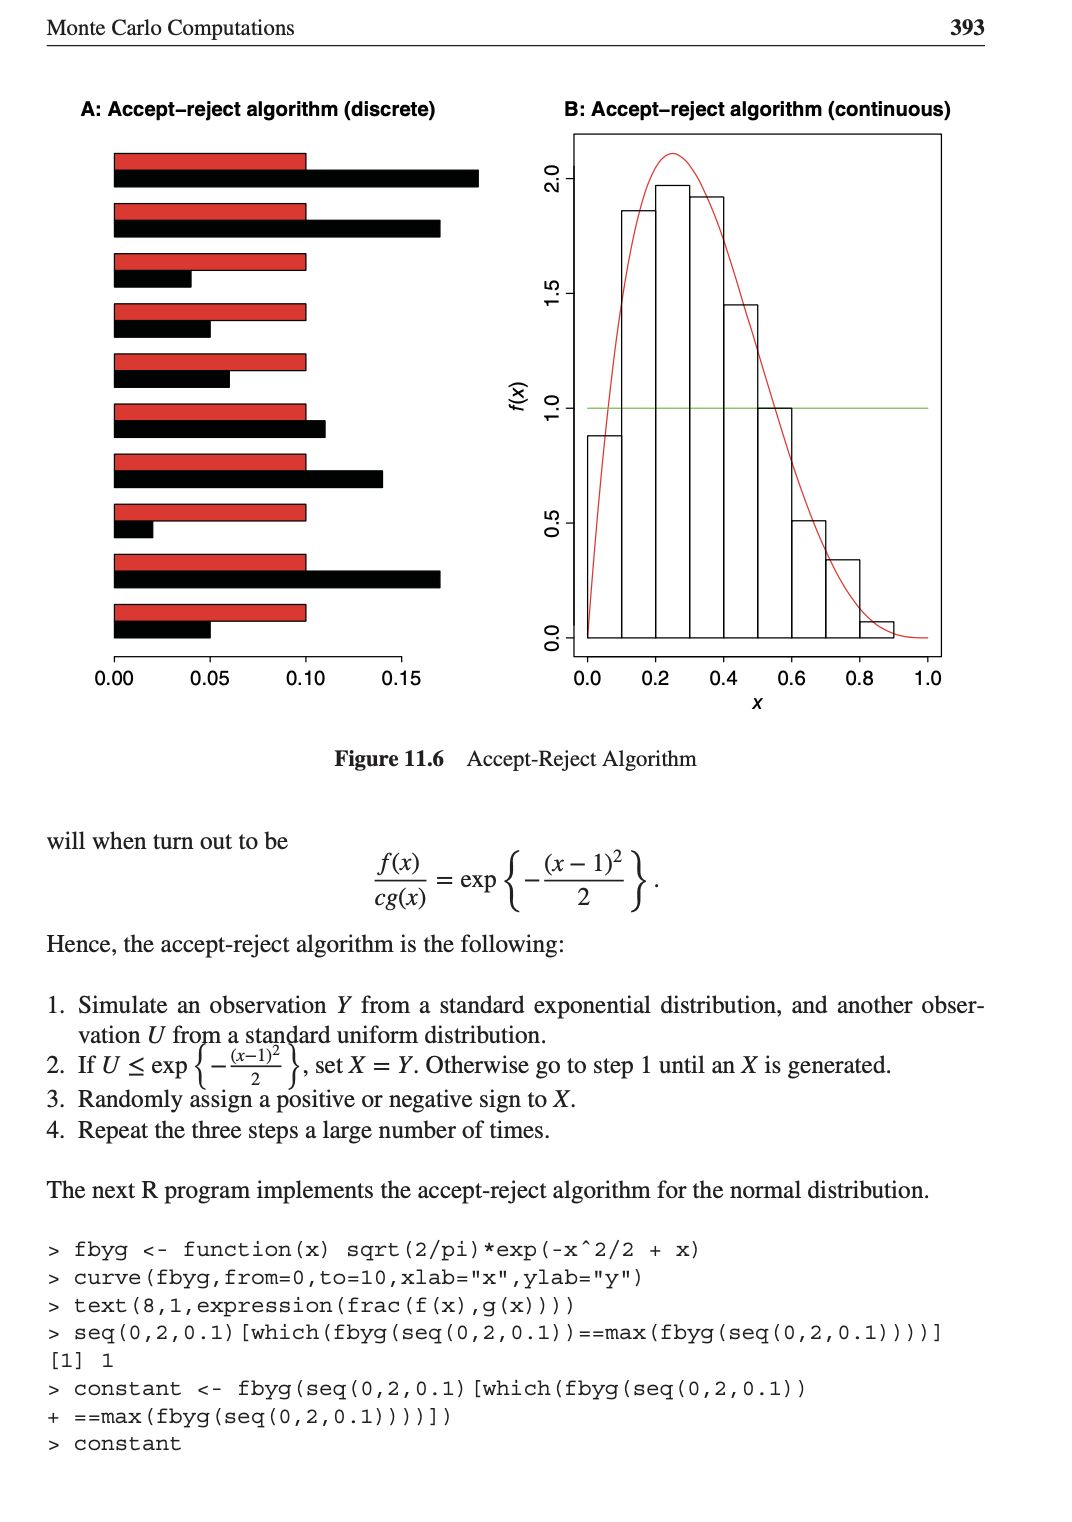
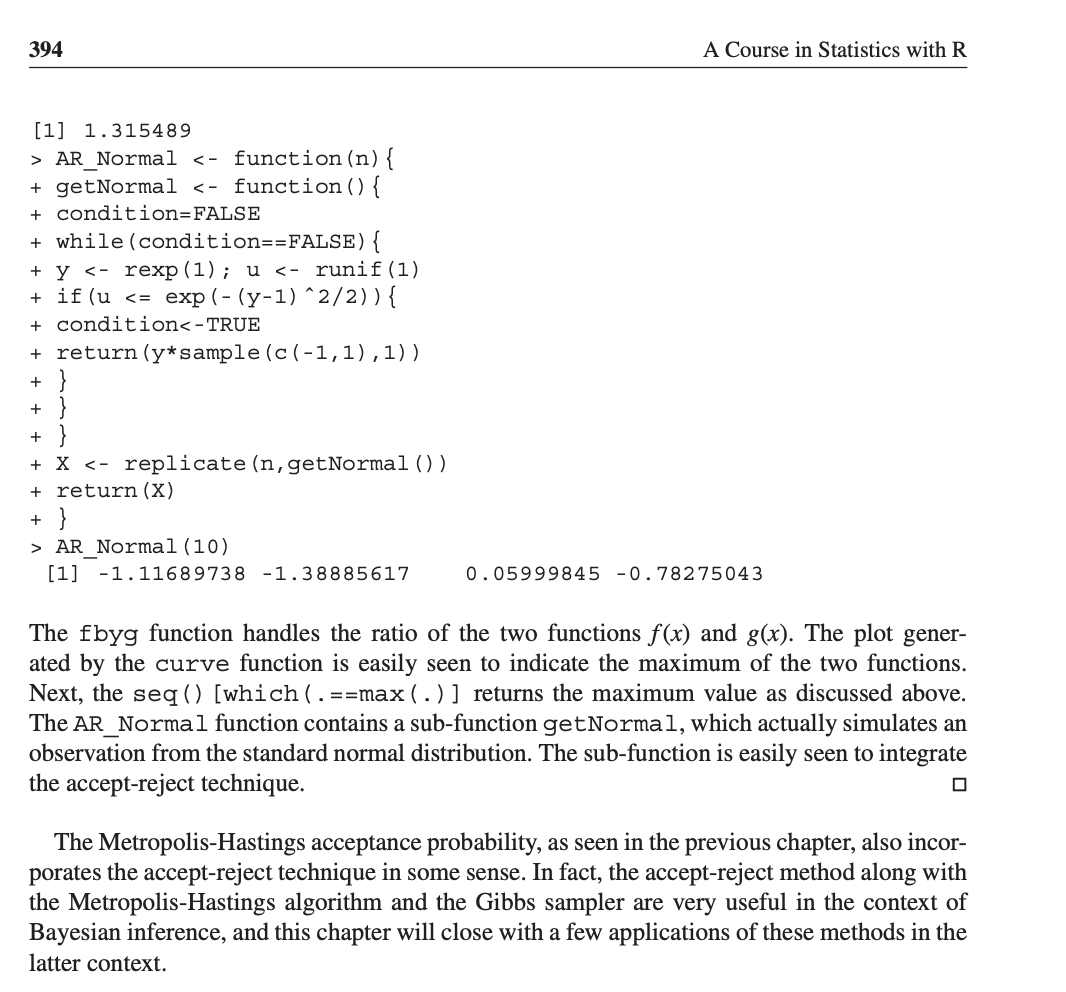
392 A Course in Statistics with R Example 11.5.2. Simulation for Beta Distribution. Let X ~ beta(2, 4), that is, f(x) = 20x(1 x)3 be the target density and the proposal density be the standard uniform density function. Now, by using curve (dbeta (x, 2 , 4) , xlab="x" , ylab="f (x) \" , col: "red") and curve (dunif (x, 0, 1) ,col="green" , add=TRUE) , it can be easily seen that the maximum value of f(x)/g(x) occurs at x = 0.25 = 1 / 4. Thus, c = max {f (x) / g(x)} = 20(1/4)(1 1/4)3 = 135/64. Now, it is easier to use the accept-reject technique. The next program implements the accept-reject algorithm for simulation from the beta distribution using the uniform density as the proposal density. curve(dbeta(x,2,4),xlab=\"x",ylab="f(x}\Monte Carlo Computations 393 A: Accept-reject algorithm (discrete) B: Accept-reject algorithm (continuous) & o. 0.00 0.05 0.10 0.15 0.0 0.2 0.4 0.6 0.8 1.0 X Figure 11.6 Accept-Reject Algorithm will when turn out to be f(x) cg(x) ~ exp _x- 1)27 2 Hence, the accept-reject algorithm is the following: 1. Simulate an observation Y from a standard exponential distribution, and another obser vation U from a standard uniform distribution. 2. If U fbyg text (8 , 1, expression (frac (f (x) , g (x) ) ) ) > seq (0, 2, 0.1) [which (fbyg (seq (0 , 2, 0.1) ) ==max (fbyg (seg (0, 2, 0.1) ) ) ) ] [1] 1 constant constant394 A Course in Statistics with R [1] 1. 315489 > AR Normal AR Normal (10) [1] -1. 11689738 -1.38885617 0 . 05999845 -0. 78275043 The fbyg function handles the ratio of the two functions f(x) and g(x). The plot gener- ated by the curve function is easily seen to indicate the maximum of the two functions. Next, the seq () [which ( . ==max ( . ) ] returns the maximum value as discussed above. The AR_Normal function contains a sub-function getNormal, which actually simulates an observation from the standard normal distribution. The sub-function is easily seen to integrate the accept-reject technique. The Metropolis-Hastings acceptance probability, as seen in the previous chapter, also incor- porates the accept-reject technique in some sense. In fact, the accept-reject method along with the Metropolis-Hastings algorithm and the Gibbs sampler are very useful in the context of Bayesian inference, and this chapter will close with a few applications of these methods in the latter context