Answered step by step
Verified Expert Solution
Link Copied!

Question

1 Approved Answer

Answer the given activity. II. Sketch the graph of each probability and find its area under the normal curve. [18 points] 8-10. Greater than z

Answer the given activity.
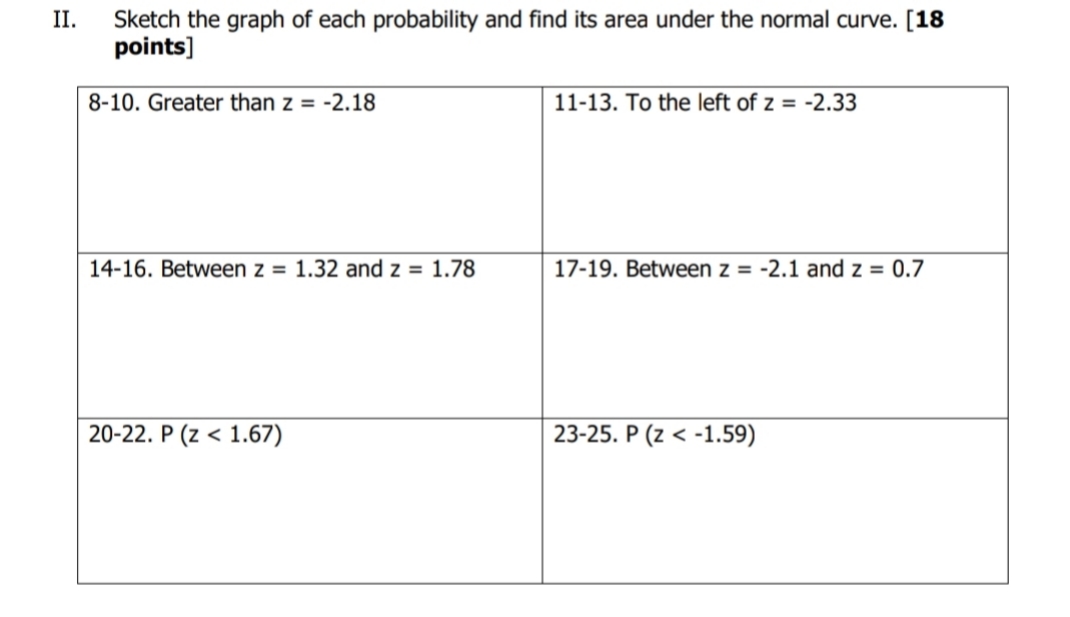
image text in transcribed
II. Sketch the graph of each probability and find its area under the normal curve. [18 points] 8-10. Greater than z = -2.18 11-13. To the left of z = -2.33 14-16. Between z = 1.32 and z = 1.78 17-19. Between z = -2.1 and z = 0.7 20-22. P (z

Step by Step Solution

There are 3 Steps involved in it

Step: 1

blur-text-image

Get Instant Access to Expert-Tailored Solutions

See step-by-step solutions with expert insights and AI powered tools for academic success

Step: 2

blur-text-image

Step: 3

blur-text-image

Ace Your Homework with AI

Get the answers you need in no time with our AI-driven, step-by-step assistance

Get Started

Recommended Textbook for

Advanced Calculus

Authors: R Creighton Buck

3rd Edition

147861613X, 9781478616139

More Books

Students also viewed these Mathematics questions

Question

Describe the linkages between HRM and strategy formulation. page 74

Answered: 1 week ago

Question

Identify approaches to improving retention rates.

Answered: 1 week ago