Answered step by step
Verified Expert Solution
Question
1 Approved Answer
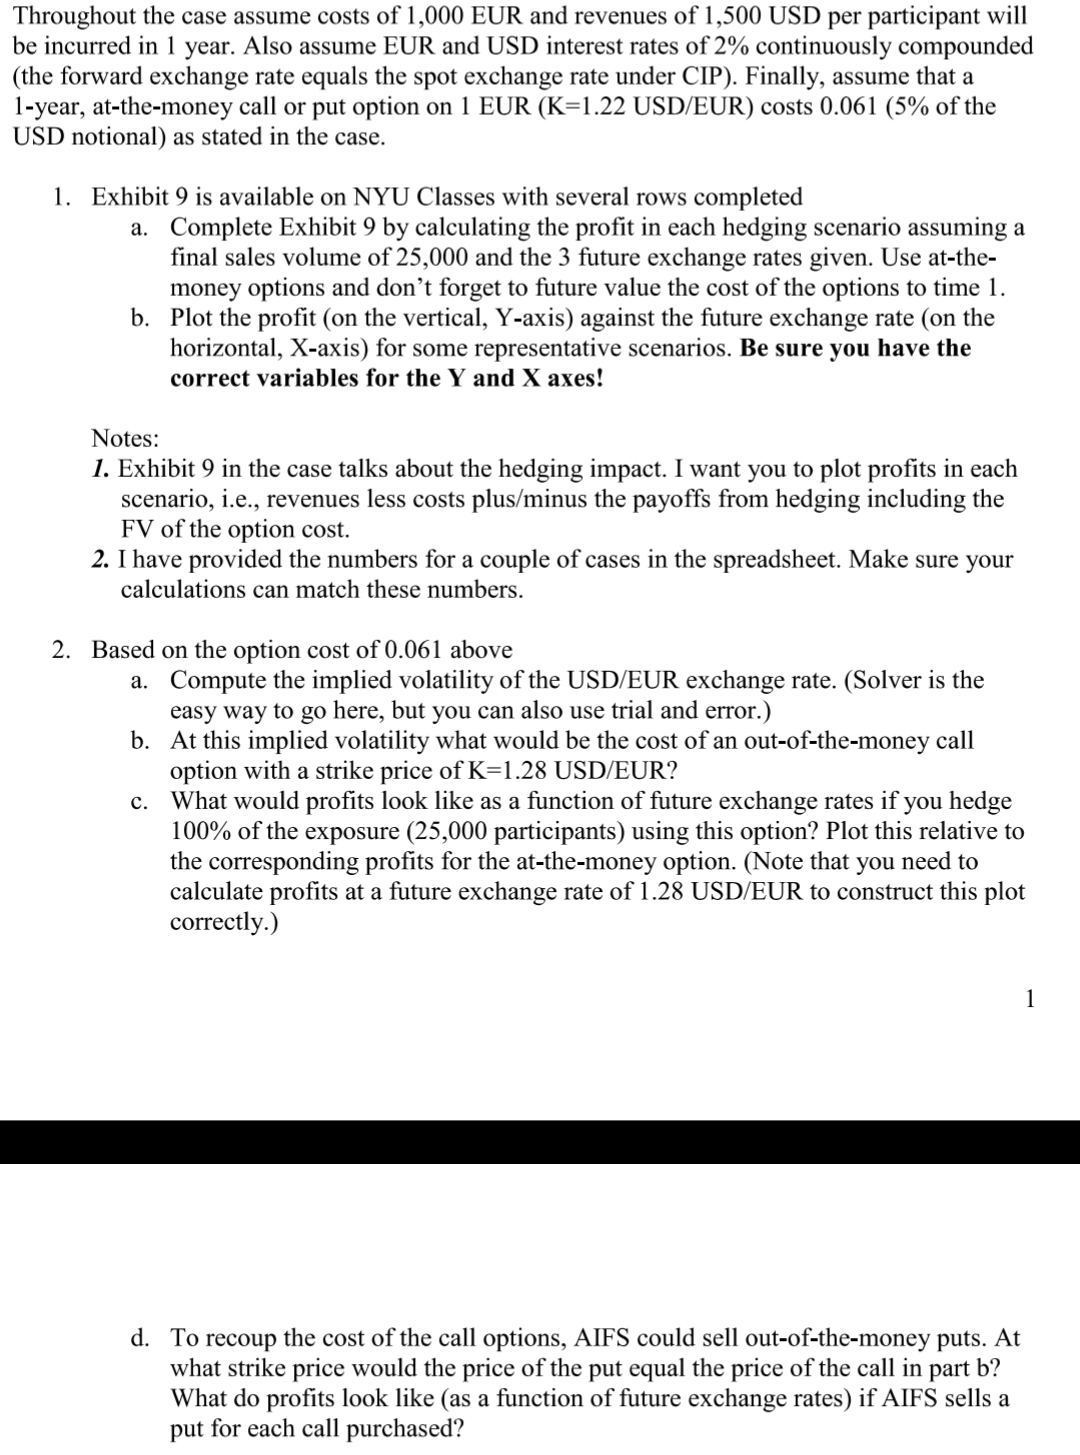
Answer the question 3 with tlfor the information use context of question 1 and 2 and excel sheet. Throughout the case assume costs of 1,000


Answer the question 3 with tlfor the information use context of question 1 and 2 and excel sheet.
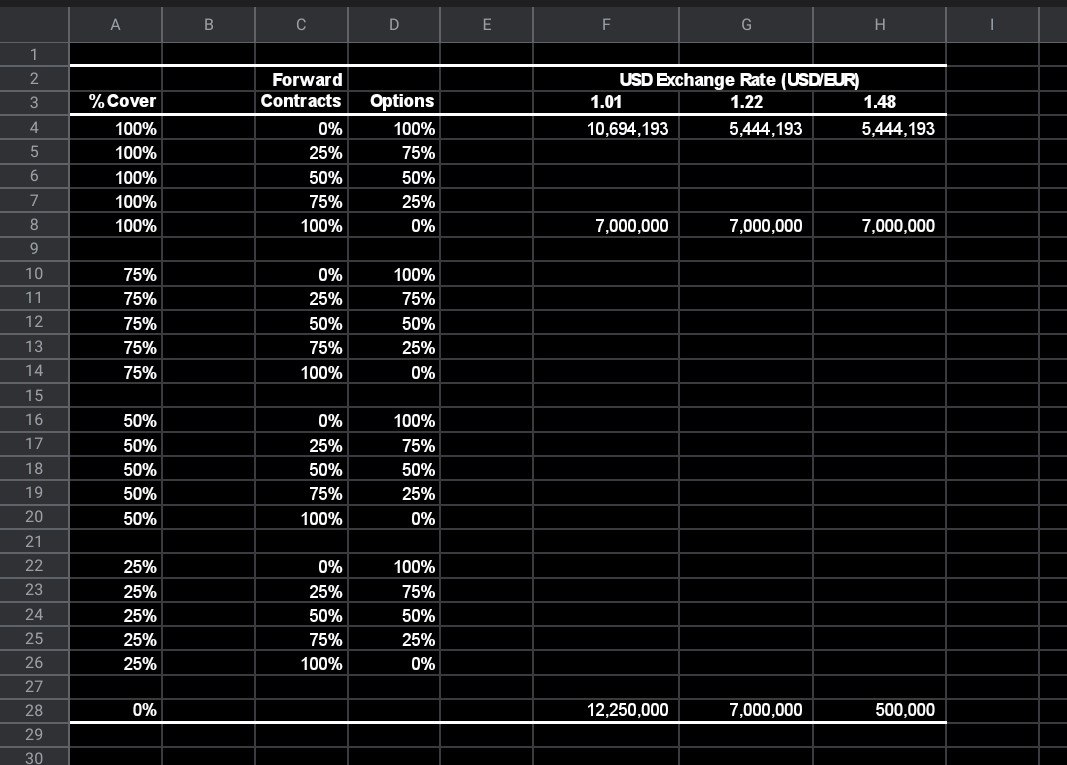
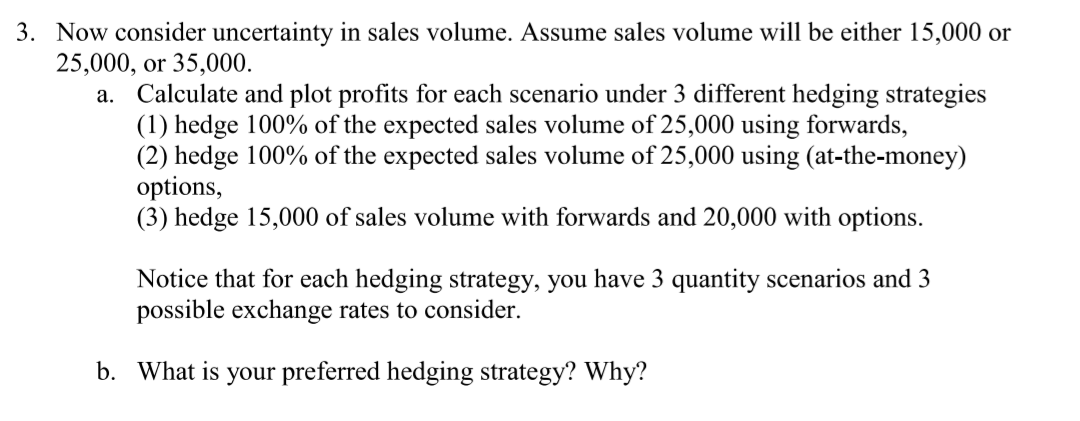
Throughout the case assume costs of 1,000 EUR and revenues of 1,500 USD per participant will be incurred in 1 year. Also assume EUR and USD interest rates of 2% continuously compounded (the forward exchange rate equals the spot exchange rate under CIP). Finally, assume that a 1-year, at-the-money call or put option on 1 EUR (K=1.22 USD/EUR) costs 0.061 (5% of the USD notional) as stated in the case. 1. Exhibit 9 is available on NYU Classes with several rows completed a. Complete Exhibit 9 by calculating the profit in each hedging scenario assuming a final sales volume of 25,000 and the 3 future exchange rates given. Use at-the- money options and don't forget to future value the cost of the options to time 1. b. Plot the profit (on the vertical, Y-axis) against the future exchange rate (on the horizontal, X-axis) for some representative scenarios. Be sure you have the correct variables for the Y and X axes! Notes: 1. Exhibit 9 in the case talks about the hedging impact. I want you to plot profits in each scenario, i.e., revenues less costs plus/minus the payoffs from hedging including the FV of the option cost. 2. I have provided the numbers for a couple of cases in the spreadsheet. Make sure your calculations can match these numbers. 2. Based on the option cost of 0.061 above a. Compute the implied volatility of the USD/EUR exchange rate. (Solver is the easy way to go here, but you can also use trial and error.) b. At this implied volatility what would be the cost of an out-of-the-money call option with a strike price of K=1.28 USD/EUR? What would profits look like as a function of future exchange rates if you hedge 100% of the exposure (25,000 participants) using this option? Plot this relative to the corresponding profits for the at-the-money option. (Note that you need to calculate profits at a future exchange rate of 1.28 USD/EUR to construct this plot correctly.) c. 1 d. To recoup the cost of the call options, AIFS could sell out-of-the-money puts. At what strike price would the price of the put equal the price of the call in part b? What do profits look like (as a function of future exchange rates) if AIFS sells a put for each call purchased? B C D E F G . 1 2 3 USD Exchange Rate (USD/EUR) 1.01 1.22 1.48 10,694,193 5,444,193 5,444,193 4 5 % Cover 100% 100% 100% 100% 100% Forward Contracts 0% 25% 50% 75% 100% Options 100% 75% 50% 25% 0% 6 7 8 9 7,000,000 7,000,000 7,000,000 10 11 12 75% 75% 75% 75% 75% 0% 25% 50% 75% 100% 100% 75% 50% 25% 0% 13 14 15 16 17 18 19 20 21 22 23 50% 50% 50% 50% 50% 0% 25% 50% 75% 100% 100% 75% 50% 25% 0% 25% 25% 25% 25% 25% 0% 25% 50% 75% 100% 100% 75% 50% 25% 0% 24 25 26 27 28 29 0% 12,250,000 7,000,000 500,000 30 3. Now consider uncertainty in sales volume. Assume sales volume will be either 15,000 or 25,000, or 35,000. a. Calculate and plot profits for each scenario under 3 different hedging strategies (1) hedge 100% of the expected sales volume of 25,000 using forwards, (2) hedge 100% of the expected sales volume of 25,000 using (at-the-money) options, (3) hedge 15,000 of sales volume with forwards and 20,000 with options. Notice that for each hedging strategy, you have 3 quantity scenarios and 3 possible exchange rates to consider. b. What is your preferred hedging strategy? Why? Throughout the case assume costs of 1,000 EUR and revenues of 1,500 USD per participant will be incurred in 1 year. Also assume EUR and USD interest rates of 2% continuously compounded (the forward exchange rate equals the spot exchange rate under CIP). Finally, assume that a 1-year, at-the-money call or put option on 1 EUR (K=1.22 USD/EUR) costs 0.061 (5% of the USD notional) as stated in the case. 1. Exhibit 9 is available on NYU Classes with several rows completed a. Complete Exhibit 9 by calculating the profit in each hedging scenario assuming a final sales volume of 25,000 and the 3 future exchange rates given. Use at-the- money options and don't forget to future value the cost of the options to time 1. b. Plot the profit (on the vertical, Y-axis) against the future exchange rate (on the horizontal, X-axis) for some representative scenarios. Be sure you have the correct variables for the Y and X axes! Notes: 1. Exhibit 9 in the case talks about the hedging impact. I want you to plot profits in each scenario, i.e., revenues less costs plus/minus the payoffs from hedging including the FV of the option cost. 2. I have provided the numbers for a couple of cases in the spreadsheet. Make sure your calculations can match these numbers. 2. Based on the option cost of 0.061 above a. Compute the implied volatility of the USD/EUR exchange rate. (Solver is the easy way to go here, but you can also use trial and error.) b. At this implied volatility what would be the cost of an out-of-the-money call option with a strike price of K=1.28 USD/EUR? What would profits look like as a function of future exchange rates if you hedge 100% of the exposure (25,000 participants) using this option? Plot this relative to the corresponding profits for the at-the-money option. (Note that you need to calculate profits at a future exchange rate of 1.28 USD/EUR to construct this plot correctly.) c. 1 d. To recoup the cost of the call options, AIFS could sell out-of-the-money puts. At what strike price would the price of the put equal the price of the call in part b? What do profits look like (as a function of future exchange rates) if AIFS sells a put for each call purchased? B C D E F G . 1 2 3 USD Exchange Rate (USD/EUR) 1.01 1.22 1.48 10,694,193 5,444,193 5,444,193 4 5 % Cover 100% 100% 100% 100% 100% Forward Contracts 0% 25% 50% 75% 100% Options 100% 75% 50% 25% 0% 6 7 8 9 7,000,000 7,000,000 7,000,000 10 11 12 75% 75% 75% 75% 75% 0% 25% 50% 75% 100% 100% 75% 50% 25% 0% 13 14 15 16 17 18 19 20 21 22 23 50% 50% 50% 50% 50% 0% 25% 50% 75% 100% 100% 75% 50% 25% 0% 25% 25% 25% 25% 25% 0% 25% 50% 75% 100% 100% 75% 50% 25% 0% 24 25 26 27 28 29 0% 12,250,000 7,000,000 500,000 30 3. Now consider uncertainty in sales volume. Assume sales volume will be either 15,000 or 25,000, or 35,000. a. Calculate and plot profits for each scenario under 3 different hedging strategies (1) hedge 100% of the expected sales volume of 25,000 using forwards, (2) hedge 100% of the expected sales volume of 25,000 using (at-the-money) options, (3) hedge 15,000 of sales volume with forwards and 20,000 with options. Notice that for each hedging strategy, you have 3 quantity scenarios and 3 possible exchange rates to consider. b. What is your preferred hedging strategy? WhyStep by Step Solution
There are 3 Steps involved in it
Step: 1

Get Instant Access to Expert-Tailored Solutions
See step-by-step solutions with expert insights and AI powered tools for academic success
Step: 2

Step: 3

Ace Your Homework with AI
Get the answers you need in no time with our AI-driven, step-by-step assistance
Get Started


