

Answered step by step
Verified Expert Solution
Question
1 Approved Answer
Answer the question in R , please. the data used is made from:http://www1.maths.leeds.ac.uk/~arief/MATH1712/data/vessels.csv Import the data into R and give an overview over the data,
Answer the question in R , please. 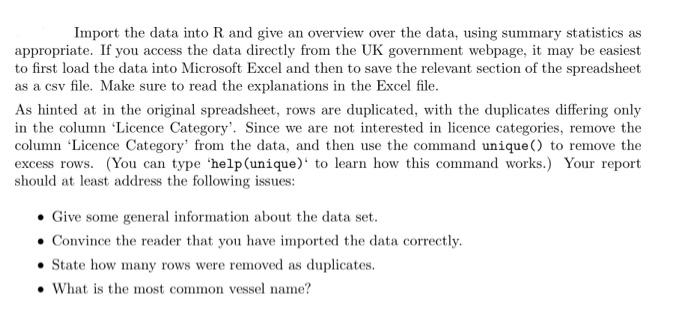
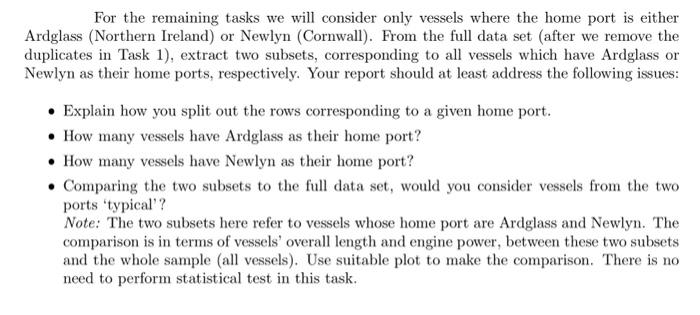
Import the data into R and give an overview over the data, using summary statistics as appropriate. If you access the data directly from the UK government webpage, it may be easiest to first load the data into Microsoft Excel and then to save the relevant section of the spreadsheet as a csv file. Make sure to read the explanations in the Excel file. As hinted at in the original spreadsheet, rows are duplicated, with the duplicates differing only in the column 'Licence Category'. Since we are not interested in licence categories, remove the column 'Licence Category' from the data, and then use the command unique() to remove the excess rows. (You can type 'help(unique)' to learn how this command works.) Your report should at least address the following issues: - Give some general information about the data set. - Convince the reader that you have imported the data correctly. - State how many rows were removed as duplicates. - What is the most common vessel name? For the remaining tasks we will consider only vessels where the home port is either Ardglass (Northern Ireland) or Newlyn (Cornwall). From the full data set (after we remove the duplicates in Task 1), extract two subsets, corresponding to all vessels which have Ardglass or Newlyn as their home ports, respectively. Your report should at least address the following issues: - Explain how you split out the rows corresponding to a given home port. - How many vessels have Ardglass as their home port? - How many vessels have Newlyn as their home port? - Comparing the two subsets to the full data set, would you consider vessels from the two ports 'typical'? Note: The two subsets here refer to vessels whose home port are Ardglass and Newlyn. The comparison is in terms of vessels' overall length and engine power, between these two subsets and the whole sample (all vessels). Use suitable plot to make the comparison. There is no need to perform statistical test in this task the data used is made from:"http://www1.maths.leeds.ac.uk/~arief/MATH1712/data/vessels.csv"
Step by Step Solution
There are 3 Steps involved in it
Step: 1

Get Instant Access to Expert-Tailored Solutions
See step-by-step solutions with expert insights and AI powered tools for academic success
Step: 2

Step: 3
Ace Your Homework with AI
Get the answers you need in no time with our AI-driven, step-by-step assistance
Get Started
Database Reliability Engineering Designing And Operating Resilient Database Systems
Authors: Laine Campbell, Charity Majors
1st Edition
978-1491925942