

Answered step by step
Verified Expert Solution
Question
1 Approved Answer
Answer the questions based on the information on the graphs. This is all the information that was given. There isnt anymore information to share with
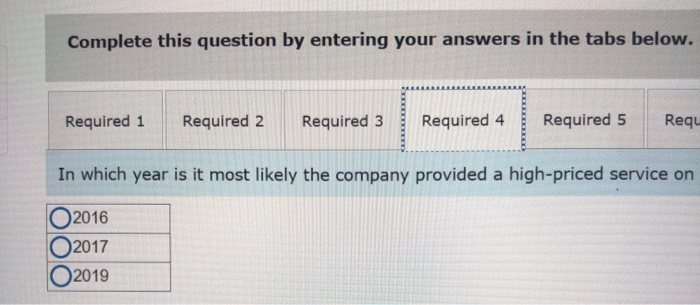
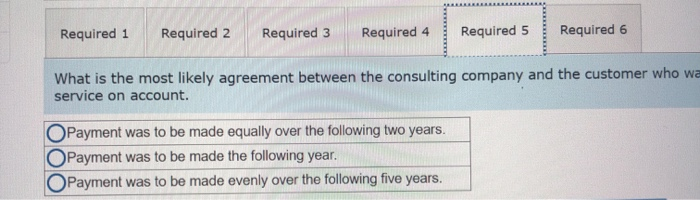
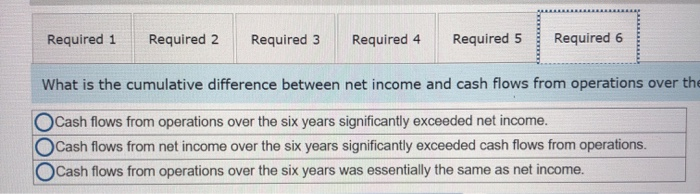

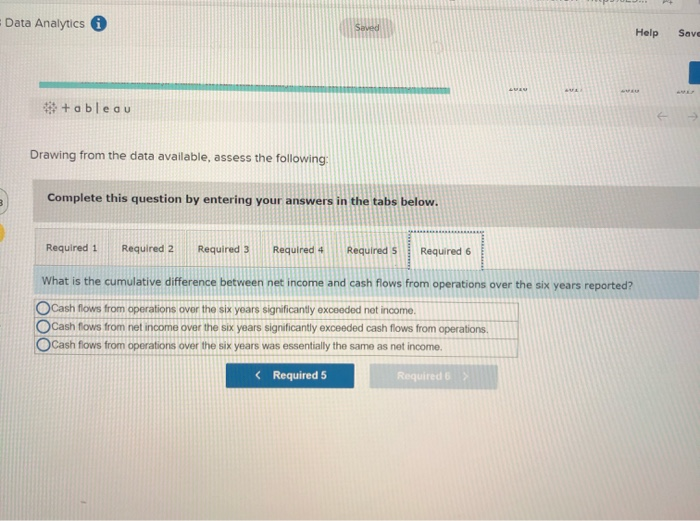
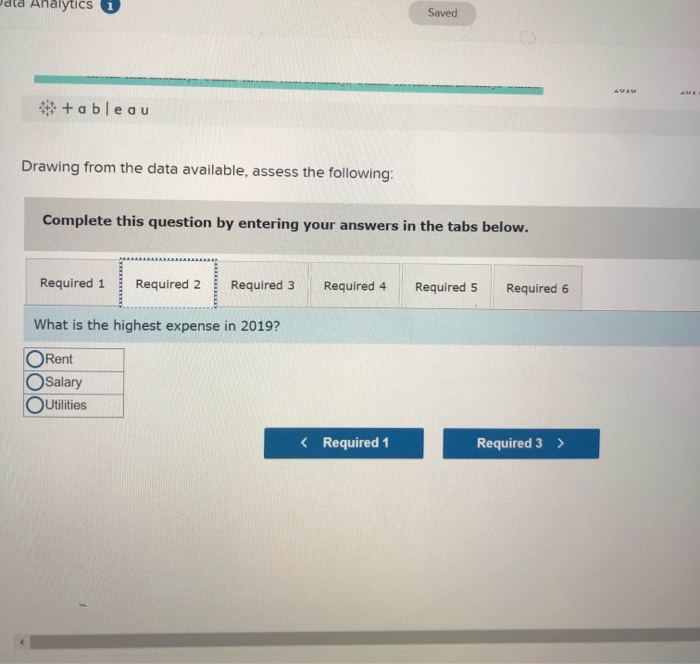
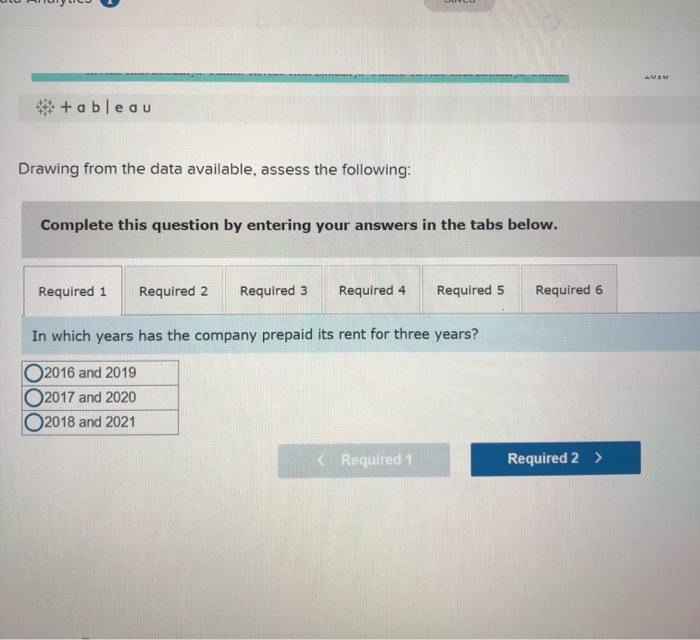
Answer the questions based on the information on the graphs. This is all the information that was given. There isnt anymore information to share with you.
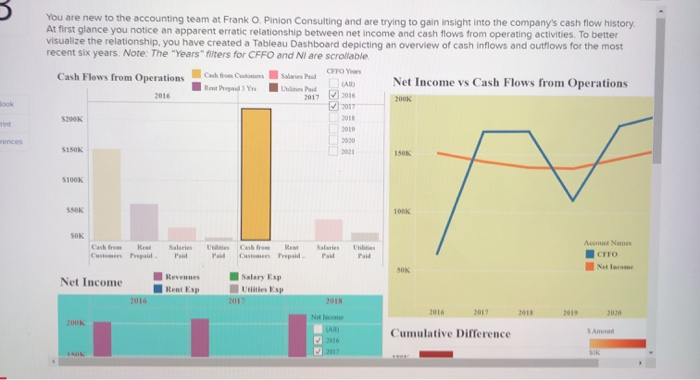
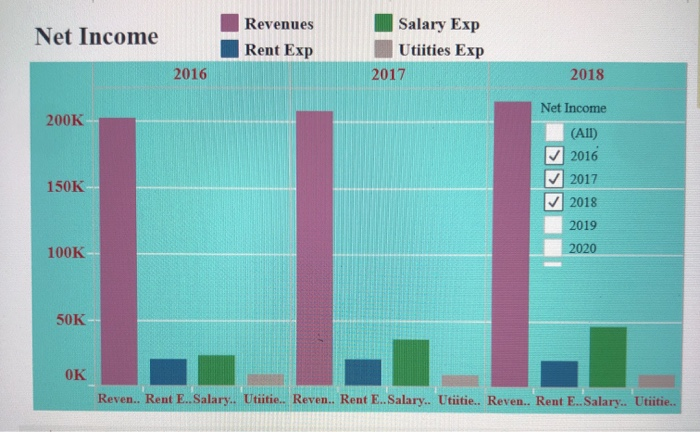
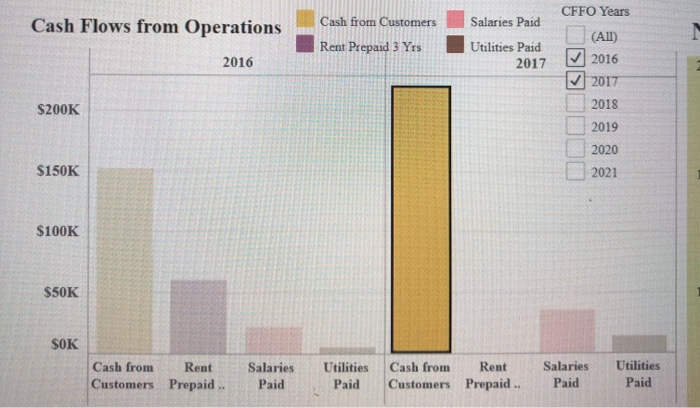
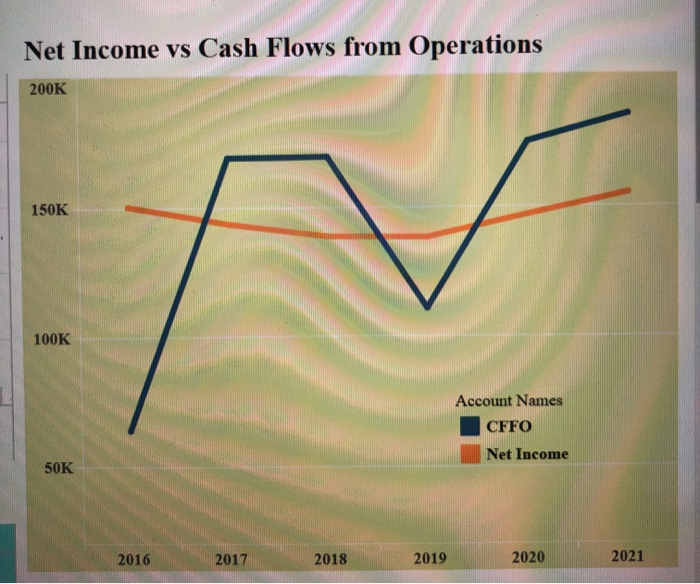
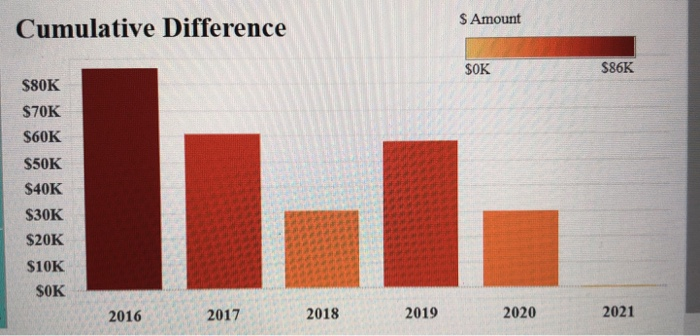
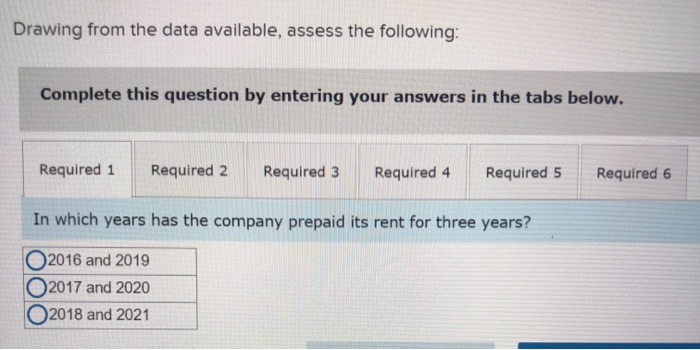
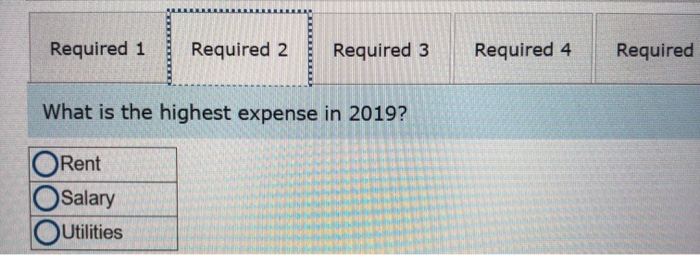
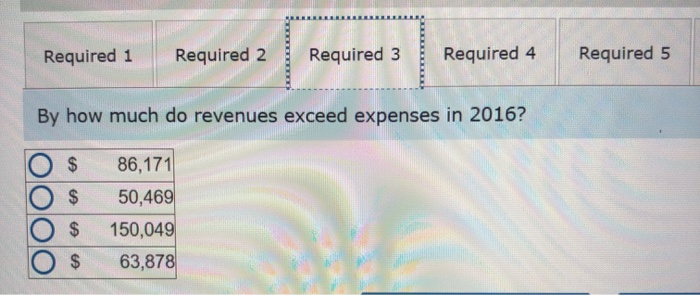
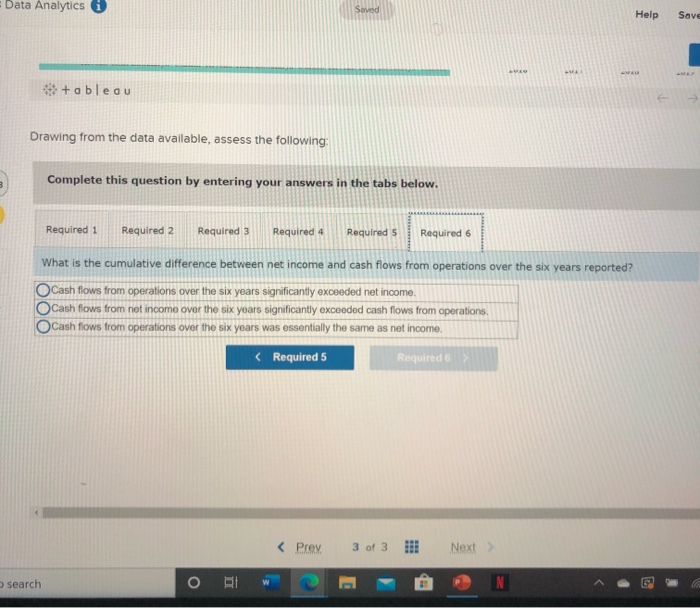
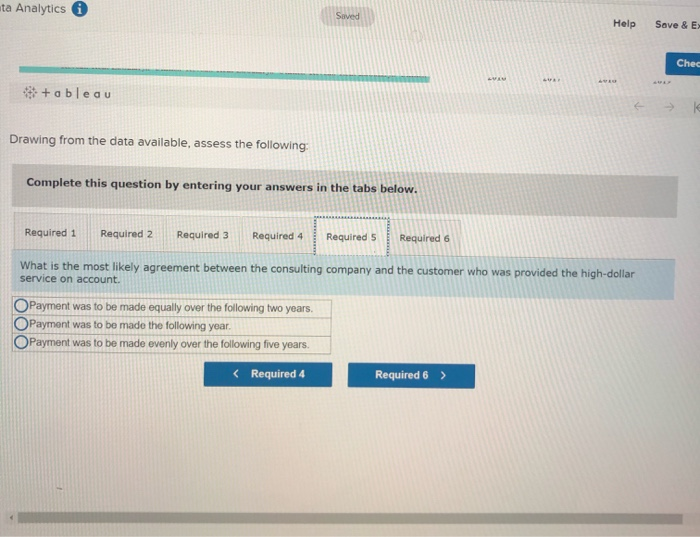
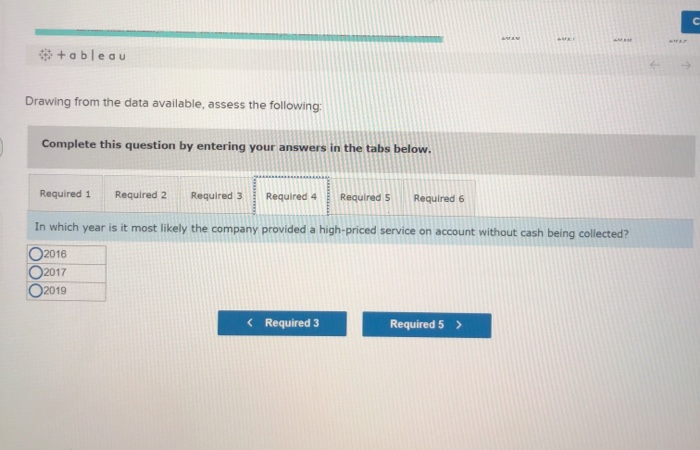
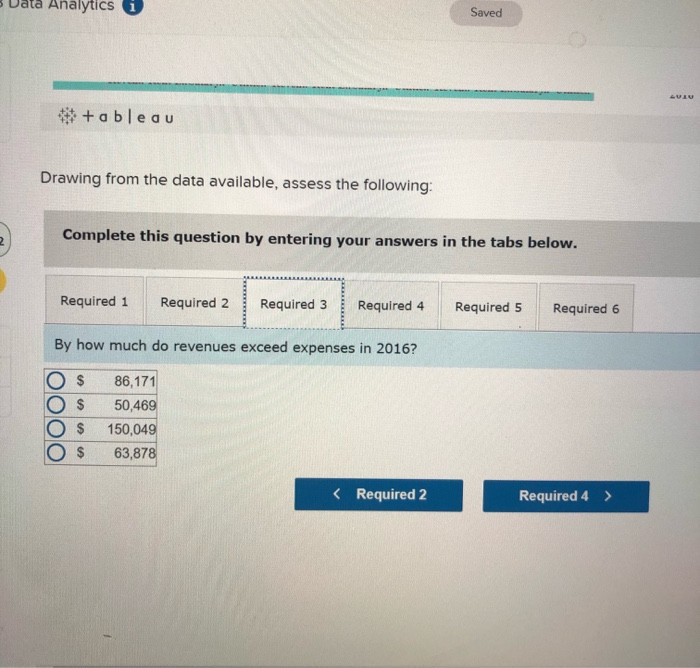
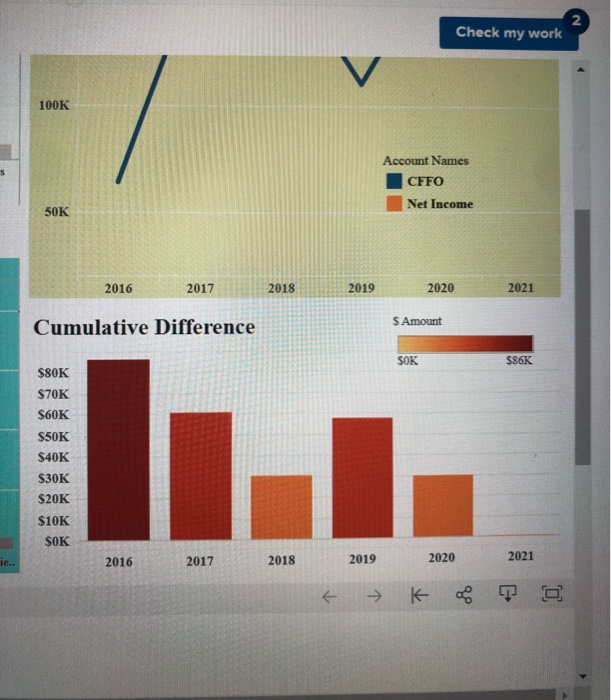
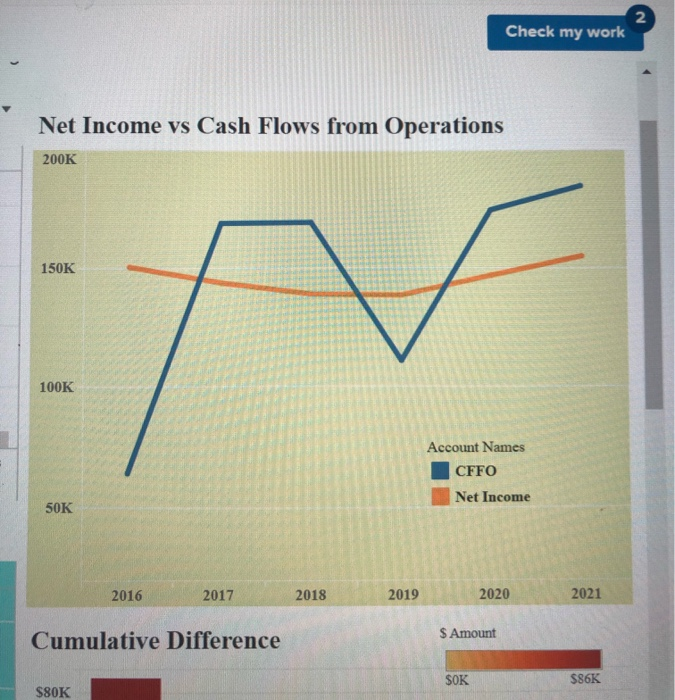
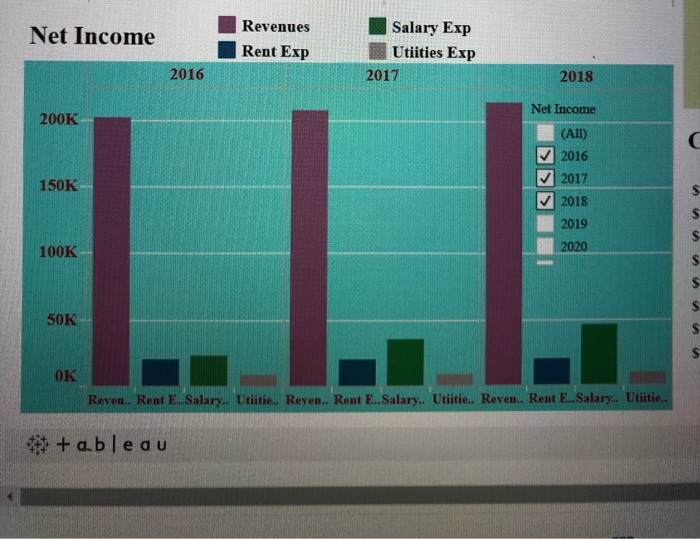
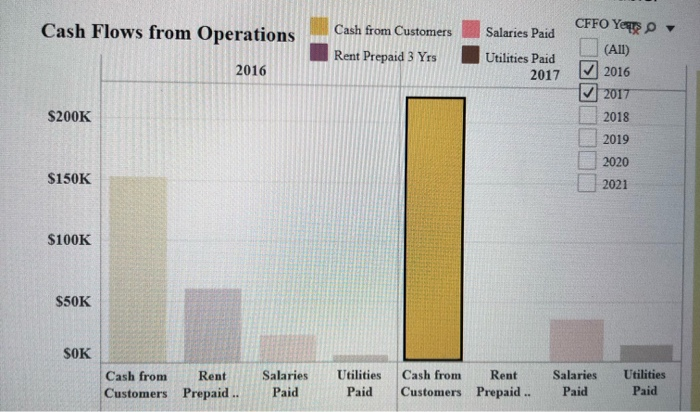
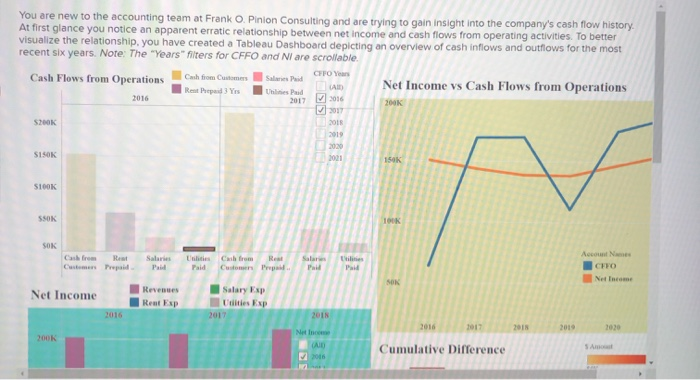
You are new to the accounting team at Franko. Pinion Consulting and are trying to gain insight into the company's cash flow history. At first glance you notice an apparent erratic relationship between net income and cash flows from operating activities. To better visualize the relationship. you have created a Tableau Dashboard depicting an overview of cash inflows and outflows for the most recent six years. Note: The "Years" filters for CFFO and Nl are scrollable GFFOY Cash Flows from Operations Cash Com Salaries Net Income vs Cash Flows from Operations Restrepid 2016 2003 2017 AD 2017 Hook S200K 2013 rences SISON ISOK S100K SOK TOK SOR Salaries R Casteen paid Rest Ces Prepaid Paid Account Names CFFO Net Salary Exp Net Income Revenues Reat Esp 2016 201N 2010 200 CAN M2016 Cumulative Difference Amor Net Income Revenues Rent Exp Salary Exp Utiities Exp 2017 2016 2018 200K Net Income (All) 2016 150K 2017 C wwar * + ableau Drawing from the data available, assess the following: Complete this question by entering your answers in the tabs below. Required 1 Required 2 Required 3 Required 4 Required 5 Required 6 In which year is it most likely the company provided a high-priced service on account without cash being collected? 2016 O 2017 2019 Analytics i Saved LURU ** + ableau Drawing from the data available, assess the following: Complete this question by entering your answers in the tabs below. Required 1 Required 2 Required 3 Required 4 Required 5 Required 6 By how much do revenues exceed expenses in 2016? $ $ 86,171 50,469 150,049 63,878 Analytics Saved * + ableau Drawing from the data available, assess the following: Complete this question by entering your answers in the tabs below. Required 1 Required 2 Required 3 Required 4 Required 5 Required 6 What is the highest expense in 2019? Rent Salary Utilities LULU 4 + ableau Drawing from the data available, assess the following: Complete this question by entering your answers in the tabs below. Required 1 Required 2 Required 3 Required 4 Required 5 Required 6 In which years has the company prepaid its rent for three years? O 2016 and 2019 O2017 and 2020 O2018 and 2021 Required 1 Required 2 > Check my work V 100K Account Names CFFO Net Income 50K 2016 2017 2018 2019 2020 2021 Cumulative Difference SAmount SOK S86K $80K $70K S60K S50K $40K $30K $20K $10K SOK 2016 le.. 2017 2018 2019 2020 2021 K TO 2 Check my work Net Income vs Cash Flows from Operations 200K 150K 100K Account Names CFFO Net Income 50K 2016 2017 2018 2019 2020 2021 Cumulative Difference S Amount SOK $86K $80K Net Income Revenues Rent Exp Salary Exp Utiities Exp 2017 2016 2018 Net Income 200K C (A1I) 2016 2017 2018 150K S $ $ 2019 100K 2020 $ S $ $ 50K $ OK Reven.. Rent E.Salary.. Utiitie. Reven.. Rent E..Salary.. Utiitie. Reven.. Rent E..Salary.. Utiitie.. ** + ableau Cash Flows from Operations Salaries Paid Cash from Customers Rent Prepaid 3 Yrs CFFO Yello (All) 2016 2017 Utilities Paid 2017 2016 $200K 2018 2019 2020 $150K 2021 $100K $50K SOK Cash from Rent Customers Prepaid .. Salaries Paid Utilities Paid Cash from Rent Customers Prepaid .. Salaries Paid Utilities Paid You are new to the accounting team at Frank O. Pinion Consulting and are trying to gain insight into the company's cash flow history. At first glance you notice an apparent erratic relationship between net income and cash flows from operating activities. To better visualize the relationship. you have created a Tableau Dashboard depicting an overview of cash inflows and outflows for the most recent six years. Note: The "Years" filters for CFFO and NI are scrollable. Cash Flows from Operations Cath from Customers Net Income vs Cash Flows from Operations 200K CHFO Yar Rent paid 3 Yrs Sales Uh Paid 2016 2017 2016 S200K OIR 2019 2020 2021 SISOK 1546 S1OOK SSOK LOK SOK Salaries Paid Cash from Real Customers Prepaid Paid Account Nam CFFO Net Income SON Net Income Revenues Rent Exp Salary Exp Utilities Exp 2017 2016 2018 2016 2017 2018 2020 200K Net Income CAID Cumulative Difference SA You are new to the accounting team at Franko. Pinion Consulting and are trying to gain insight into the company's cash flow history. At first glance you notice an apparent erratic relationship between net income and cash flows from operating activities. To better visualize the relationship. you have created a Tableau Dashboard depicting an overview of cash inflows and outflows for the most recent six years. Note: The "Years" filters for CFFO and Nl are scrollable GFFOY Cash Flows from Operations Cash Com Salaries Net Income vs Cash Flows from Operations Restrepid 2016 2003 2017 AD 2017 Hook S200K 2013 rences SISON ISOK S100K SOK TOK SOR Salaries R Casteen paid Rest Ces Prepaid Paid Account Names CFFO Net Salary Exp Net Income Revenues Reat Esp 2016 201N 2010 200 CAN M2016 Cumulative Difference Amor Net Income Revenues Rent Exp Salary Exp Utiities Exp 2017 2016 2018 200K Net Income (All) 2016 150K 2017 C wwar * + ableau Drawing from the data available, assess the following: Complete this question by entering your answers in the tabs below. Required 1 Required 2 Required 3 Required 4 Required 5 Required 6 In which year is it most likely the company provided a high-priced service on account without cash being collected? 2016 O 2017 2019 Analytics i Saved LURU ** + ableau Drawing from the data available, assess the following: Complete this question by entering your answers in the tabs below. Required 1 Required 2 Required 3 Required 4 Required 5 Required 6 By how much do revenues exceed expenses in 2016? $ $ 86,171 50,469 150,049 63,878 Analytics Saved * + ableau Drawing from the data available, assess the following: Complete this question by entering your answers in the tabs below. Required 1 Required 2 Required 3 Required 4 Required 5 Required 6 What is the highest expense in 2019? Rent Salary Utilities LULU 4 + ableau Drawing from the data available, assess the following: Complete this question by entering your answers in the tabs below. Required 1 Required 2 Required 3 Required 4 Required 5 Required 6 In which years has the company prepaid its rent for three years? O 2016 and 2019 O2017 and 2020 O2018 and 2021 Required 1 Required 2 > Check my work V 100K Account Names CFFO Net Income 50K 2016 2017 2018 2019 2020 2021 Cumulative Difference SAmount SOK S86K $80K $70K S60K S50K $40K $30K $20K $10K SOK 2016 le.. 2017 2018 2019 2020 2021 K TO 2 Check my work Net Income vs Cash Flows from Operations 200K 150K 100K Account Names CFFO Net Income 50K 2016 2017 2018 2019 2020 2021 Cumulative Difference S Amount SOK $86K $80K Net Income Revenues Rent Exp Salary Exp Utiities Exp 2017 2016 2018 Net Income 200K C (A1I) 2016 2017 2018 150K S $ $ 2019 100K 2020 $ S $ $ 50K $ OK Reven.. Rent E.Salary.. Utiitie. Reven.. Rent E..Salary.. Utiitie. Reven.. Rent E..Salary.. Utiitie.. ** + ableau Cash Flows from Operations Salaries Paid Cash from Customers Rent Prepaid 3 Yrs CFFO Yello (All) 2016 2017 Utilities Paid 2017 2016 $200K 2018 2019 2020 $150K 2021 $100K $50K SOK Cash from Rent Customers Prepaid .. Salaries Paid Utilities Paid Cash from Rent Customers Prepaid .. Salaries Paid Utilities Paid You are new to the accounting team at Frank O. Pinion Consulting and are trying to gain insight into the company's cash flow history. At first glance you notice an apparent erratic relationship between net income and cash flows from operating activities. To better visualize the relationship. you have created a Tableau Dashboard depicting an overview of cash inflows and outflows for the most recent six years. Note: The "Years" filters for CFFO and NI are scrollable. Cash Flows from Operations Cath from Customers Net Income vs Cash Flows from Operations 200K CHFO Yar Rent paid 3 Yrs Sales Uh Paid 2016 2017 2016 S200K OIR 2019 2020 2021 SISOK 1546 S1OOK SSOK LOK SOK Salaries Paid Cash from Real Customers Prepaid Paid Account Nam CFFO Net Income SON Net Income Revenues Rent Exp Salary Exp Utilities Exp 2017 2016 2018 2016 2017 2018 2020 200K Net Income CAID Cumulative Difference SA Step by Step Solution
There are 3 Steps involved in it
Step: 1

Get Instant Access to Expert-Tailored Solutions
See step-by-step solutions with expert insights and AI powered tools for academic success
Step: 2

Step: 3
Ace Your Homework with AI
Get the answers you need in no time with our AI-driven, step-by-step assistance
Get Started
Advanced Quality Auditing An Auditors Review Of Risk Management Lean Improvement And Data Analysis
Authors: Lance B Coleman
1st Edition
163694082X, 978-1636940823