Answered step by step
Verified Expert Solution
Question
1 Approved Answer
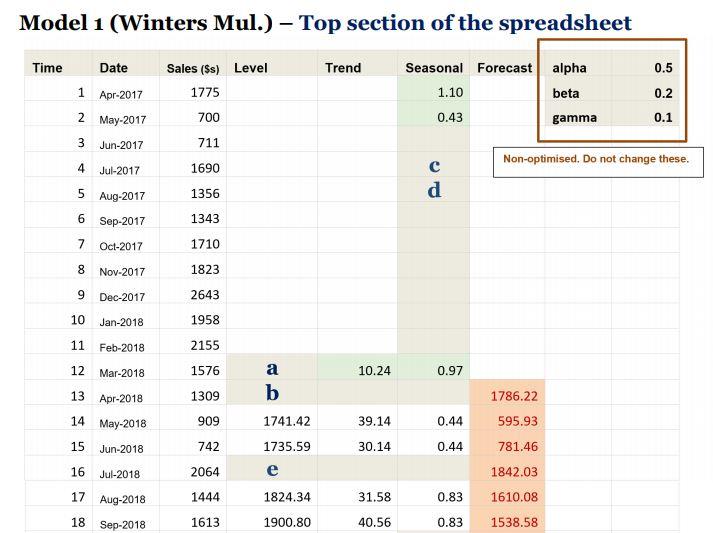
answer the value of a, b,c etc highlighted values Answer all questions. Report numerical answers to 2 decimal places. Just as you have for Exercises


answer the value of a, b,c etc highlighted values
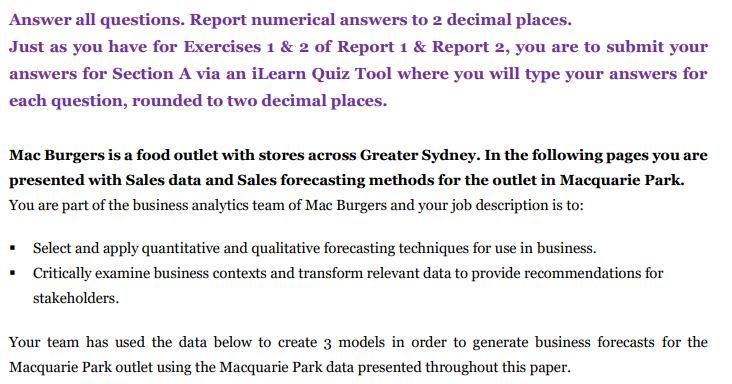
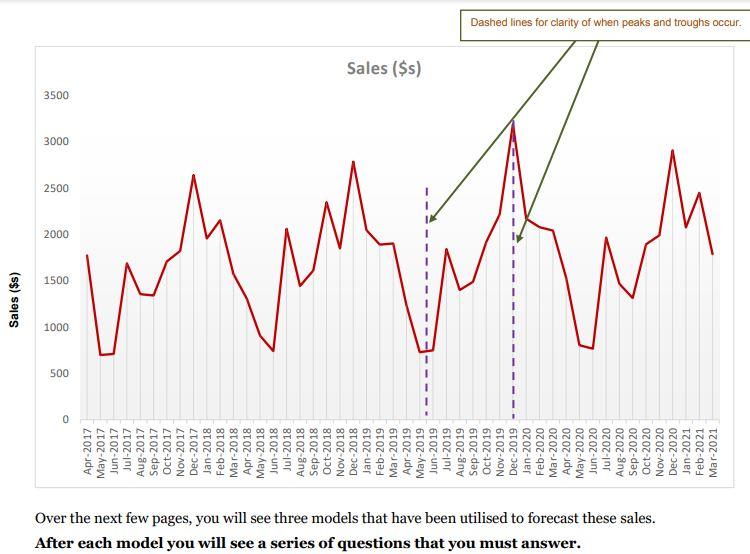
Answer all questions. Report numerical answers to 2 decimal places. Just as you have for Exercises 1 & 2 of Report 1 & Report 2, you are to submit your answers for Section A via an iLearn Quiz Tool where you will type your answers for each question, rounded to two decimal places. Mac Burgers is a food outlet with stores across Greater Sydney. In the following pages you are presented with Sales data and Sales forecasting methods for the outlet in Macquarie Park. You are part of the business analytics team of Mae Burgers and your job description is to: Select and apply quantitative and qualitative forecasting techniques for use in business. Critically examine business contexts and transform relevant data to provide recommendations for stakeholders. Your team has used the data below to create 3 models in order to generate business forecasts for the Macquarie Park outlet using the Macquarie Park data presented throughout this paper. Sales ($s) 500 1000 1500 2000 2500 3000 3500 0 After each model you will see a series of questions that you must answer. Over the next few pages, you will see three models that have been utilised to forecast these sales. Apr-2017 May-2017 Jun-2017 Jul-2017 Aug-2017 Sep-2017 Oct-2017 Nov-2017 Dec-2017 Jan-2018 Feb-2018 Mar-2018 Apr-2018 May 2018 Jun-2018 Jul-2018 Aug-2018 Sep-2018 Oct-2018 Nov-2018 Dec-2018 Jan-2019 Feb-2019 Mar-2019 Apr-2019 May-2019 Jun-2019 Jul-2019 Aug-2019 Sep-2019 Oct-2019 Nov-2019 Dec-2019 Jan-2020 Feb-2020 Mar-2020 Apr-2020 May-2020 Jun-2020 Jul-2020 Aug-2020 Sep-2020 Oct-2020 Nov-2020 Dec-2020 Jan-2021 Feb-2021 Mar-2021 Sales ($s) Dashed lines for clarity of when peaks and troughs occur. Model 1 (Winters Mul.) - Top section of the spreadsheet Time Date Sales (Ss) Level Trend Seasonal Forecast alpha 0.5 1 Apr-2017 1775 1.10 beta 0.2 2 May-2017 700 0.43 gamma 0.1 3 Jun-2017 711 Non-optimised. Do not change these. 4 Jul-2017 1690 5 Aug-2017 1356 d 6 Sep-2017 1343 7 Oct-2017 1710 8 Nov-2017 1823 9 9 Dec-2017 2643 10 Jan-2018 1958 11 Feb-2018 2155 12 [ Mar-2018 1576 10.24 0.97 13 Apr-2018 1309 b 1786.22 14 May-2018 909 1741.42 39.14 0.44 595.93 15 Jun-2018 742 1735.59 30.14 0.44 781.46 16 Jul-2018 2064 e 1842.03 17 Aug-2018 1444 1824.34 31.58 0.83 1610.08 18 Sep-2018 1613 1900.80 40.56 0.83 1538.58 Answer all questions. Report numerical answers to 2 decimal places. Just as you have for Exercises 1 & 2 of Report 1 & Report 2, you are to submit your answers for Section A via an iLearn Quiz Tool where you will type your answers for each question, rounded to two decimal places. Mac Burgers is a food outlet with stores across Greater Sydney. In the following pages you are presented with Sales data and Sales forecasting methods for the outlet in Macquarie Park. You are part of the business analytics team of Mae Burgers and your job description is to: Select and apply quantitative and qualitative forecasting techniques for use in business. Critically examine business contexts and transform relevant data to provide recommendations for stakeholders. Your team has used the data below to create 3 models in order to generate business forecasts for the Macquarie Park outlet using the Macquarie Park data presented throughout this paper. Sales ($s) 500 1000 1500 2000 2500 3000 3500 0 After each model you will see a series of questions that you must answer. Over the next few pages, you will see three models that have been utilised to forecast these sales. Apr-2017 May-2017 Jun-2017 Jul-2017 Aug-2017 Sep-2017 Oct-2017 Nov-2017 Dec-2017 Jan-2018 Feb-2018 Mar-2018 Apr-2018 May 2018 Jun-2018 Jul-2018 Aug-2018 Sep-2018 Oct-2018 Nov-2018 Dec-2018 Jan-2019 Feb-2019 Mar-2019 Apr-2019 May-2019 Jun-2019 Jul-2019 Aug-2019 Sep-2019 Oct-2019 Nov-2019 Dec-2019 Jan-2020 Feb-2020 Mar-2020 Apr-2020 May-2020 Jun-2020 Jul-2020 Aug-2020 Sep-2020 Oct-2020 Nov-2020 Dec-2020 Jan-2021 Feb-2021 Mar-2021 Sales ($s) Dashed lines for clarity of when peaks and troughs occur. Model 1 (Winters Mul.) - Top section of the spreadsheet Time Date Sales (Ss) Level Trend Seasonal Forecast alpha 0.5 1 Apr-2017 1775 1.10 beta 0.2 2 May-2017 700 0.43 gamma 0.1 3 Jun-2017 711 Non-optimised. Do not change these. 4 Jul-2017 1690 5 Aug-2017 1356 d 6 Sep-2017 1343 7 Oct-2017 1710 8 Nov-2017 1823 9 9 Dec-2017 2643 10 Jan-2018 1958 11 Feb-2018 2155 12 [ Mar-2018 1576 10.24 0.97 13 Apr-2018 1309 b 1786.22 14 May-2018 909 1741.42 39.14 0.44 595.93 15 Jun-2018 742 1735.59 30.14 0.44 781.46 16 Jul-2018 2064 e 1842.03 17 Aug-2018 1444 1824.34 31.58 0.83 1610.08 18 Sep-2018 1613 1900.80 40.56 0.83 1538.58
Step by Step Solution
There are 3 Steps involved in it
Step: 1

Get Instant Access to Expert-Tailored Solutions
See step-by-step solutions with expert insights and AI powered tools for academic success
Step: 2

Step: 3

Ace Your Homework with AI
Get the answers you need in no time with our AI-driven, step-by-step assistance
Get Started


