Answer these
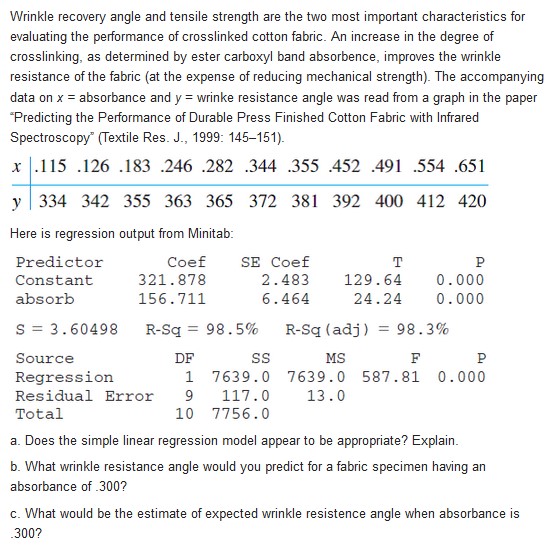
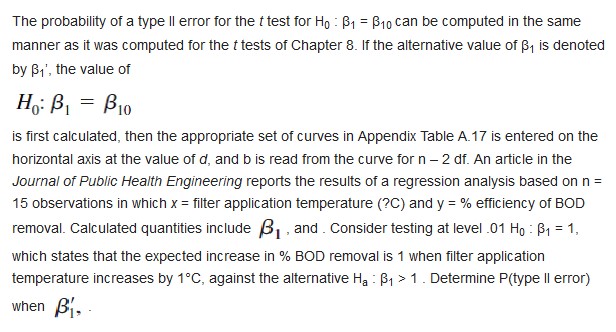
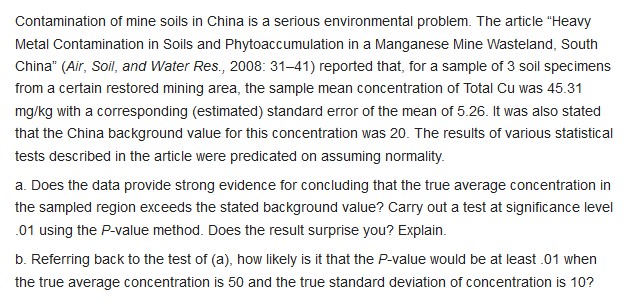
Wrinkle recovery angle and tensile strength are the two most important characteristics for evaluating the performance of crosslinked cotton fabric. An increase in the degree of crosslinking, as determined by ester carboxyl band absorbence, improves the wrinkle resistance of the fabric (at the expense of reducing mechanical strength). The accompanying data on x = absorbance and y = wrinke resistance angle was read from a graph in the paper "Predicting the Performance of Durable Press Finished Cotton Fabric with Infrared Spectroscopy" (Textile Res. J., 1999: 145-151). x .115 .126 .183 .246 .282 .344 .355 .452 .491 .554 .651 y 334 342 355 363 365 372 381 392 400 412 420 Here is regression output from Minitab: Predictor Coef SE Coef T P Constant 321 . 878 2.483 129 .64 0. 000 absorb 156. 711 6. 464 24.24 0. 000 S = 3. 60498 R-Sq = 98.5% R-Sq (adj ) = 98.3% Source DF SS MS F P Regression 1 7639.0 7639.0 587.81 0.000 Residual Error 9 117.0 13.0 Total 0 7756.0 a. Does the simple linear regression model appear to be appropriate? Explain. b. What wrinkle resistance angle would you predict for a fabric specimen having an absorbance of .300? c. What would be the estimate of expected wrinkle resistence angle when absorbance is 300?The probability of a type ll error for the t test for Ho : 1 = $10 can be computed in the same manner as it was computed for the t tests of Chapter 8. If the alternative value of B, is denoted by B1', the value of Ho: B1 = Bio is first calculated, then the appropriate set of curves in Appendix Table A.17 is entered on the horizontal axis at the value of d, and b is read from the curve for n - 2 df. An article in the Journal of Public Health Engineering reports the results of a regression analysis based on n = 15 observations in which x = filter application temperature (?C) and y = % efficiency of BOD removal. Calculated quantities include 3, and . Consider testing at level .01 Ho : B1 = 1, which states that the expected increase in % BOD removal is 1 when filter application temperature increases by 1'C, against the alternative Ha : B, > 1 . Determine P(type ll error) when\fContamination of mine soils in China is a serious environmental problem. The article "Heavy Metal Contamination in Soils and Phytoaccumulation in a Manganese Mine Wasteland, South China" (Air, Soil, and Water Res., 2008: 31-41) reported that, for a sample of 3 soil specimens from a certain restored mining area, the sample mean concentration of Total Cu was 45.31 mg/kg with a corresponding (estimated) standard error of the mean of 5.26. It was also stated that the China background value for this concentration was 20. The results of various statistical tests described in the article were predicated on assuming normality. a. Does the data provide strong evidence for concluding that the true average concentration in the sampled region exceeds the stated background value? Carry out a test at significance level 01 using the P-value method. Does the result surprise you? Explain. b. Referring back to the test of (a), how likely is it that the P-value would be at least .01 when the true average concentration is 50 and the true standard deviation of concentration is 10?The article "Characterization of Highway Runoff in Austin, Texas, Area" (J. of Envir Engr., 1998: 131-137) gave a scatterplot, along with the least squares line, of x = rainfull volume (m ) and y = runoff volume (m ) for a particular location. The accompanying values were read from the plot. X U 12 14 17 23 30 40 47 4 10 13 15 15 25 27 46 55 67 72 81 96 112 127 38 46 53 70 82 99 100 a. Does a scatterplot of the data support the use of the simple linear regression model? b. Calculate point estimates of the slope and intercept of the population regression line. c. Calculate a point estimate of the true average runoff volume when rainfall volume is 50. d. Calculate a point estimate of the standard deviation o. e. What proportion of the observed variation in runoff volume can be attributed to the simple linear regression relationship between runoff and rainfall
