answer this is R
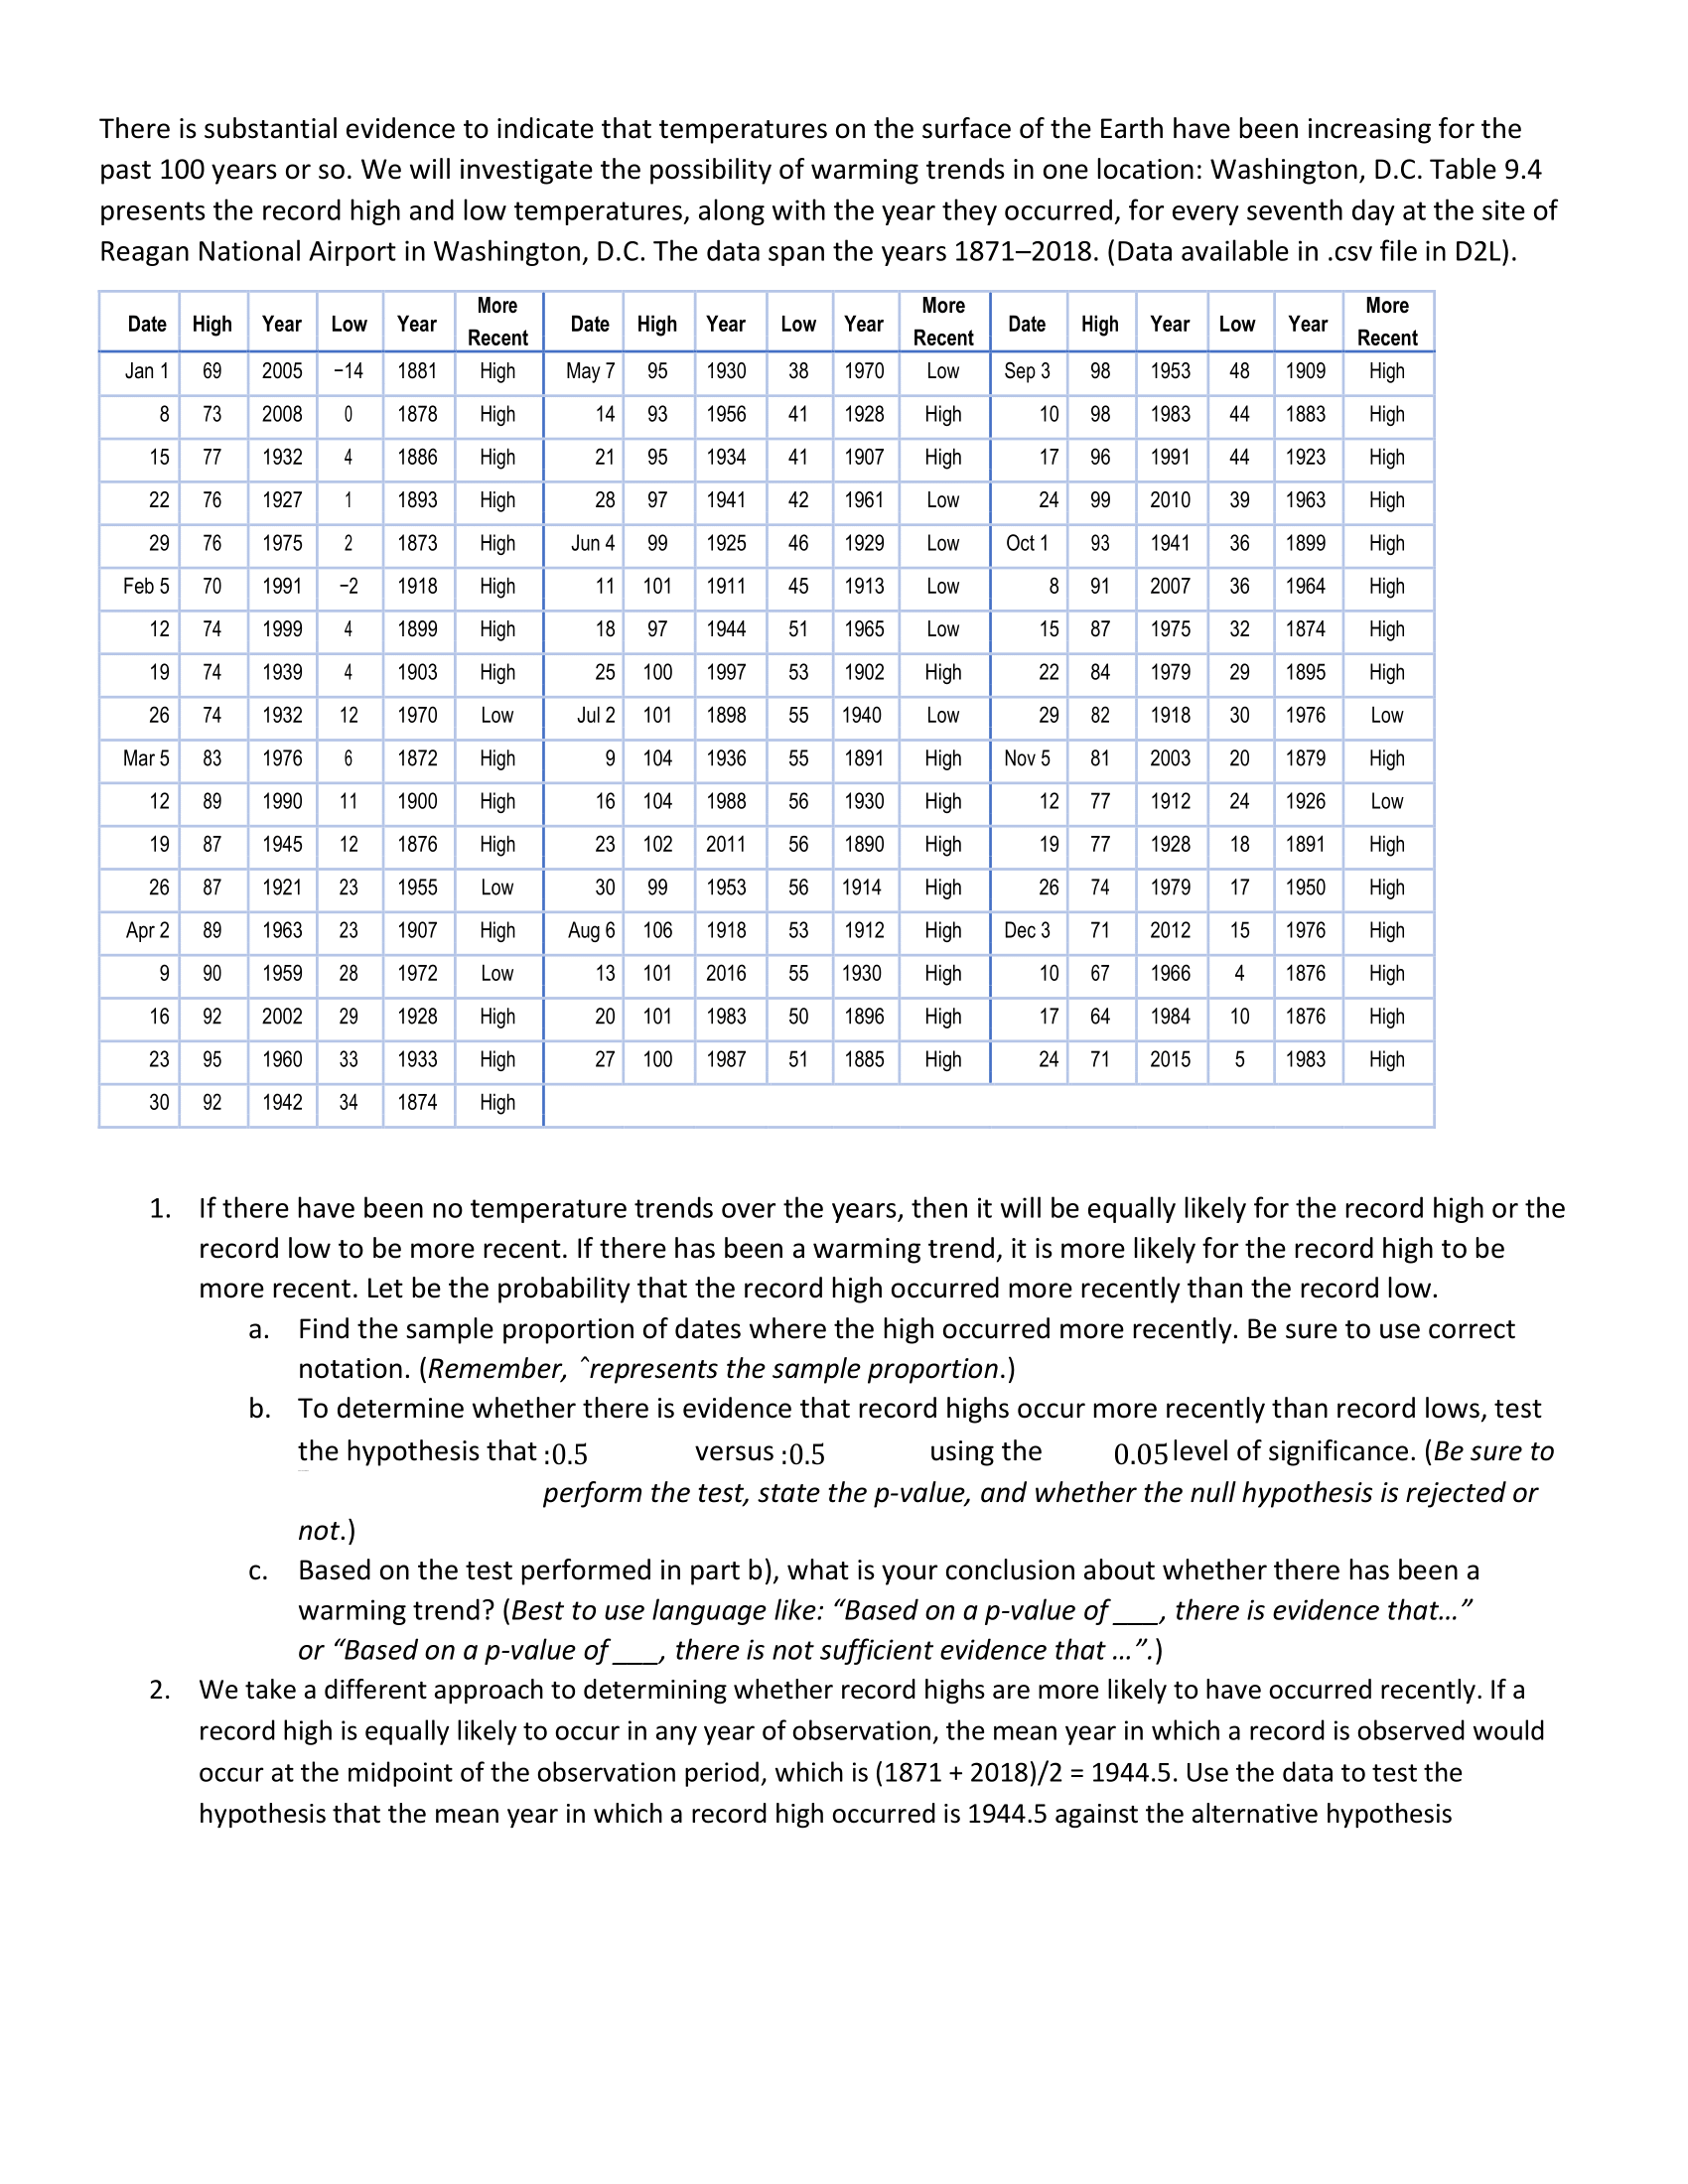
There is substantial evidence to indicate that temperatures on the surface of the Earth have been increasing for the past 100 years or so. We will investigate the possibility of warming trends in one location: Washington, D.C. Table 9.4 presents the record high and low temperatures, along with the year they occurred, for every seventh day at the site of Reagan National Airport in Washington, D.C. The data span the years 18712018. (Data available in .csv file in DZL). Dale High Year Low I Year More Date High Year Low IYear More Date High IYear ILow Year More Recent Recent Recent Jam 69 2005 14 1991 High May? 95 1930 39 1970 Low Sepa 99 1953 49 1909 High 9 73 2009 o 1979 High 14 93 1959 41 1929 High 10 99 I 1993 44 1993 High 15 77 1932 4 | 1999 | High 21 95 1934 41 | 1907 High 17 99 | 1991 | 44 1923 High | l_l _ _l_ 22 79 1927 1 1993 I High 29 97 W 1931 Low 24' 99 I 2010 WWI 29 79 1975 2 1973 Jun4 99 Elm Low 01:11 93 1941 39 1999 El Feb5 70 1991 2 | 1919 I High 11 101 1911 45 IE Low 9 WI 39 1994 High | 12 74 1999 4 1999 I High 19 97 1944 E 51 I 1995 Low 15' 97 I 1975 I 32 1974 High I 19 74 1939 4 1903 High 25 100 mm High 22 WI 29 1995 WI 29 74 1932 12 | 1970 | Low Ju|2 101 1999 55 |1940 Low 29 92 | 1919|1975 Low | _ l Mar5 93 W 1972 High 9 104 W 1991 High N0v5 WI 1979 High I 12 39 1990 11 1900 High 19 104 1939 59 1930 High 12 77I 1912 24 1929 Law 19 97 1945 12 | 1979 | High 23 102 2011 59 | 1990 High 19 77 |1929| 1991 High | 29 97 1921 23 1955 Low 30 99 WW High 29 TIMI18| 1950 High I Apr2 99 1993 23 1907 Augs 109 EW High D903 lE 9 T 1959 29 | 1972 | Low 13 101 2019 55 IR High 10 97 |1|999 1979 High | 19 T 2002 29 1929 High 20 WM 50 W High 17 TIMI0| 1979 High I 23 95 1990 33 I 1933 I High 27 100 1997 51 I 1995 High 24 II2015 1993 High I |_30i 1942 34 | 1974 | High __ | 1. If there have been no temperature trends over the years, then it will be equally likely for the record high or the record low to be more recent. If there has been a warming trend, it is more likely for the record high to be more recent. Let be the probability that the record high occurred more recently than the record low. a. Find the sample proportion of dates where the high occurred more recently. Be sure to use correct notation. (Remember, \"represents the sample proportion.) b. To determine whether there is evidence that record highs occur more recently than record lows, test the hypothesis that :05 versus :05 using the 0,05 level of significance. (Be sure to perform the test, state the p-value, and whether the null hypothesis is rejected or not.) c. Based on the test performed in part b), what is your conclusion about whether there has been a warming trend? (Best to use language like: \"Based on a pvalue of_, there is evidence that...\" or \"Based on a pvalue of_, there is not su'icient evidence that \".) 2. We take a different approach to determining whether record highs are more likely to have occurred recently. If a record high is equally likely to occur in any year of observation, the mean year in which a record is observed would occur at the midpoint of the observation period, which is (1871 + 2018)]2 = 1944.5. Use the data to test the hypothesis that the mean year in which a record high occurred is 1944.5 against the alternative hypothesis that it is greater. (Be sure to state the null and alternate hypotheses, check assumptions, perform the test, state the p-value, whether the null hypothesis is rejected or not, and state a conclusion based on your p-value.) State a conclusion about whether record highs are more likely to have occurred recently. We take one more approach on the issue. If there has been a warming trend, then we would expect the mean year in which a record low occurred to be less than the midpoint of the observation period, 1944.5. Use the data to test the hypothesis that the mean year in which a record low occurred is 1944.5 against the alternative hypothesis that it is less. (Be sure to state the null and alternate hypotheses, check assumptions, perform the test, state the p-value, whether the null hypothesis is rejected or not, and state a conclusion based on your p- value.) State a conclusion about whether record lows are more likely to have occurred more in the past. Based on the hypothesis tests performed, describe how strong you believe the evidence to be that there has been a warming trend over the observation period