Answered step by step
Verified Expert Solution
Link Copied!

Question

1 Approved Answer

Answer this question for my script: What do you think the reason why the researchers conducted this research? why they want to know the relationship

Answer this question for my script:

What do you think the reason why the researchers conducted this research? why they want to know the relationship between the hours invented in making the project and the Big task scores?

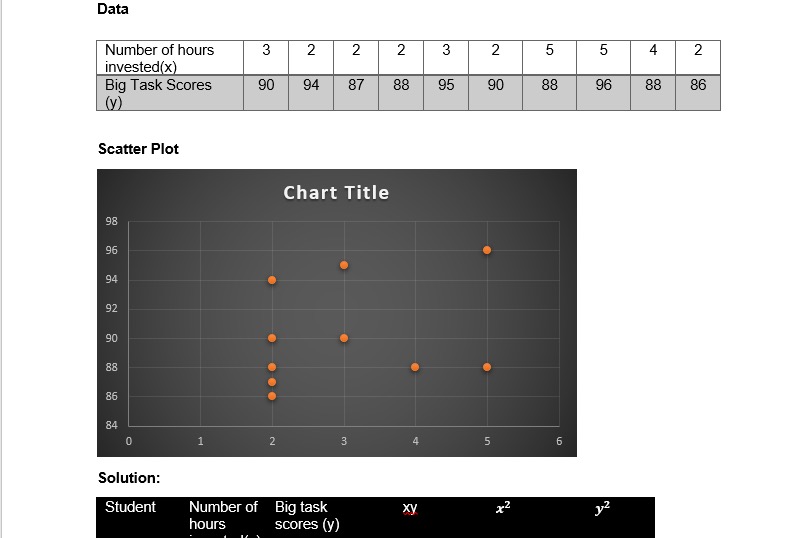
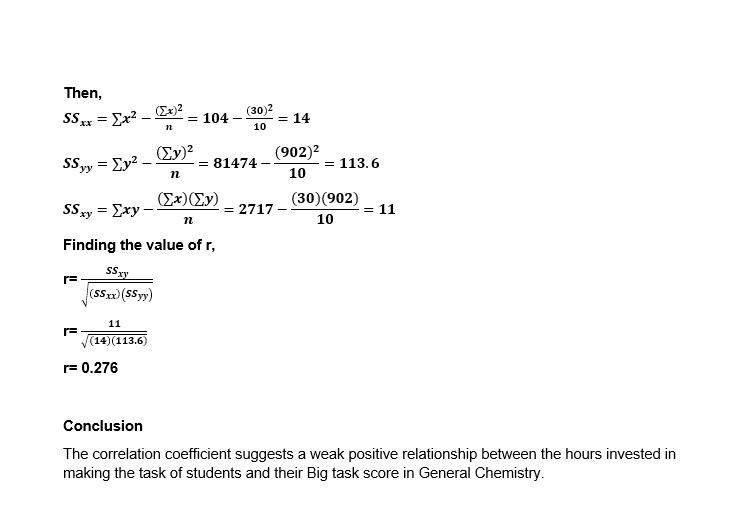
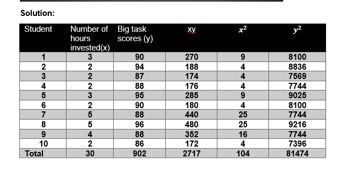
Explain the scotterplot, the gathered data and the conclusion. (Use formal and easy to understand English)

image text in transcribedimage text in transcribedimage text in transcribed
Data Number of hours 3 2 2 2 3 2 5 5 4 2 invested(x) Big Task Scores 90 94 87 88 95 90 88 96 88 86 (y) Scatter Plot Chart Title 98 96 94 92 90 88 86 84 1 2 3 4 5 6 Solution: Student Number of Big task xy hours scores (y)Then, = 104 - (30)2 = 14 10 5Spy = Ey2 (902)2 = 81474 = 113.6 n 10 55 xy = Exy (30) (902) = 2717 =11 10 Finding the value of r, SS TV 1= (SS xx) (SSyy) 11 r= (14) (113.6) r= 0.276 Conclusion The correlation coefficient suggests a weak positive relationship between the hours invested in making the task of students and their Big task score in General Chemistry.Solution: Student Number of Big task XY hours (y) invested(x) 90 270 8100 94 188 8536 87 174 7569 88 178 7744 95 205 9025 NLCONUNANG 90 180 8100 440 7744 96 400 25 9216 352 16 7744 10 86 172 4 7396 Total 902 104 81474

Step by Step Solution

There are 3 Steps involved in it

Step: 1

blur-text-image

Get Instant Access to Expert-Tailored Solutions

See step-by-step solutions with expert insights and AI powered tools for academic success

Step: 2

blur-text-image

Step: 3

blur-text-image

Ace Your Homework with AI

Get the answers you need in no time with our AI-driven, step-by-step assistance

Get Started

Recommended Textbook for

Intermediate Algebra

Authors: Marvin L Bittinger

11th Edition

ISBN: 0321968395, 9780321968395

More Books

Students also viewed these Mathematics questions