ANSWER THIS QUESTION:
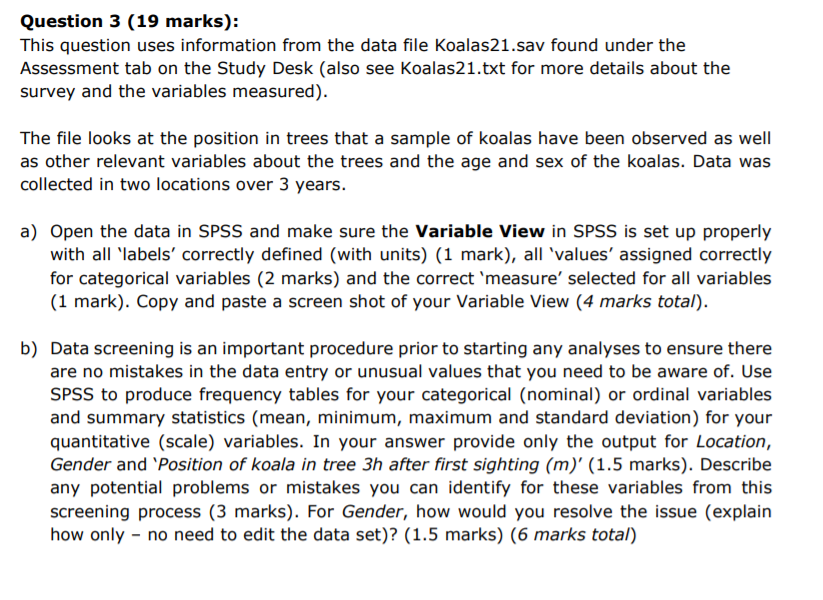
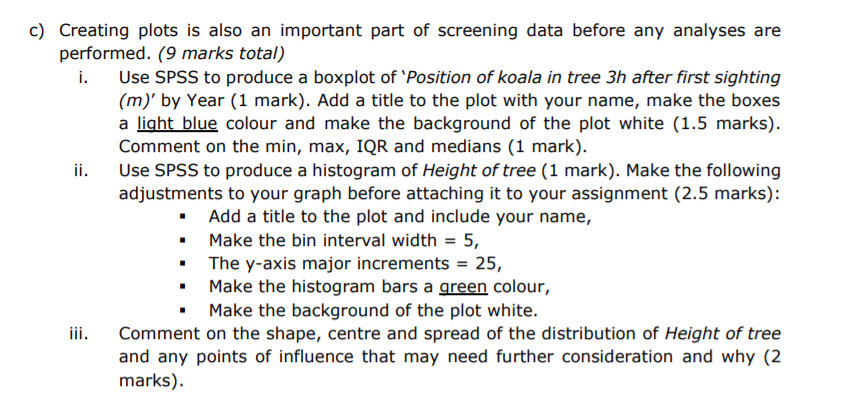
Question 3 (19 marks): This question uses information from the data le Koalas21.sav found under the Assessment tab on the Study Desk (also see Koala521.txt for more details about the survey and the variables measured). The le looks at the position in trees that a sample of koalas have been observed as well as other relevant variables about the trees and the age and sex of the koalas. Data was collected in two locations over 3 years. a) Open the data in SPSS and make sure the Variable View in SPSS is set up properly with all 'labels' correctly dened (with units) (1 mark), all 'values' assigned correctly for categorical variables (2 marks) and the correct 'measure' selected for all variables (1 mark). Copy and paste a screen shot of your lv'ariable View (4 marks totai). b) Data screening is an important procedure prior to starting any analyses to ensure there are no mistakes in the data entry or unusual values that you need to be aware of. Use SPSS to produce frequency tables for your categorical (nominal) or ordinal variables and summary statistics (mean, minimum, maximum and standard deviation) for your quantitative (scale) variables. In your answer provide only the output for Location, Gender and 'Position of koaia in tree 3h after first sighting (n1)' (15 marks}. Describe any potential problems or mistakes you can identify for these variables from this screening process (3 marks). For Gender, how would you resolve the issue (explain how only no need to edit the data set)? (1.5 marks) (6 marks totai) c) Creating plots is also an important part of screening data before any analyses are performed. (9 marks totai) Use SPSS to produce a boxplot of 'Position of koaia in tree 3h after rst sighting (m)' by Year (1 mark). Add a title to the plot with your name, make the boxes a light blue colour and make the background of the plot white (1.5 marks). Comment on the min, max, IQR and medians (1 mark). Use SPSS to produce a histogram of Height oftree (1 mark). Make the following adjustments to your graph before attaching it to your assignment (2.5 marks): - Add a title to the plot and include your name, - Make the bin interval width = 5, - The y-axis major increment-z = 25, - Make the histogram bars a 93:11 colour, - Make the background of the plot white. Comment or. the shape, centre and spread of the distribution of Height of tree and any points of inuence that may need further consideration and why (2 marks)


