Answered step by step
Verified Expert Solution
Link Copied!

Question

1 Approved Answer

answer to problem 22-19 Book Horngrens-Cost Acciunting A managerial Emphasis - 16 Edition HEwgers u uie argar company 22-19 Transfer-pricing methods, goal congruence. Calgary Lumber

answer to problem 22-19 Book Horngrens-Cost Acciunting A managerial Emphasis - 16 Edition
image text in transcribed
HEwgers u uie argar company 22-19 Transfer-pricing methods, goal congruence. Calgary Lumber has a raw lumber division and a fin- ishad lumber division. The variable costs are as follows Raw lumber division: $125 per 100 board-feet of raw lumber Finished lumber division: $145 per 100 board-feet of finished lumber Assume that there is no board-feet loss in processing raw lumber into finished lumber Raw lumber can be sold at $175 per 100 board-feat Finished lumber can be sold at $345 per 100 board-feet 1 Should Calgary Lumber process raw lumber into its finished form? Show your calculations 2 Assume that internal transfers are made at 130% of variable cost Will each division maximize its divi- sion operating-income contribution by adopting the action that is in the best interest of Calgary Lumber as a wholo? Explain 3 Assume that internal transfors are made at market prices. Will each division maximize its division oparating-income contribution by adopting the action that is in the best interest of Calgary Lumber as a whole? Explain ad 23-22 Performance Ald, Inc. has two divisions: Test Preparation and Language Arts. Results (in millions) for the past three years are partially displayed he Home Insert Page Layout Formulas Data Review View A D G C Operating Operating Operating Income Total Income Revenues Operating Operating Total Income Operating Revenues Total Assets Revenues Assets Assets 1 Test Preparation Division 2015 2 3 $630 $ 7,500 $1,500 ? 7 11% 44.0% 990 1,110 4 2016 12% 5.0 ? 5 2017 Language Arts Division 2015 6 ? $ 2,600 3,000 7 $ 650 $1,625 22.5% 2016 2017 1,875 2,500 8 2.0 25.0 % Performance Aid, Inc. 2015 10 $1,280 $10,100 $3,125 7 11 12 2016 ? 13 2017 ? Required: 1. Complete the table by filling in the blanks. 2. Use the DuPont method of profitability analysis to explain changes in the operating-income-to-total-assets ratios over the 2015-2017 perlod for Aid as a whole. Comment on the results

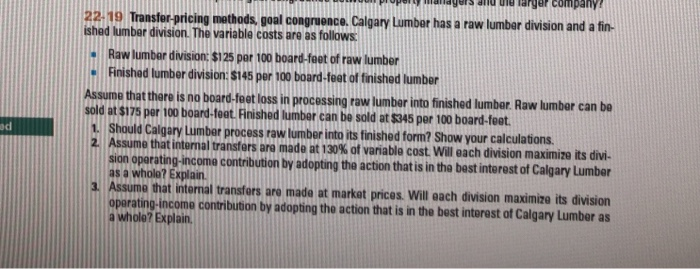
Step by Step Solution

There are 3 Steps involved in it

Step: 1

blur-text-image

Get Instant Access to Expert-Tailored Solutions

See step-by-step solutions with expert insights and AI powered tools for academic success

Step: 2

blur-text-image

Step: 3

blur-text-image

Ace Your Homework with AI

Get the answers you need in no time with our AI-driven, step-by-step assistance

Get Started

Recommended Textbook for

More Books

Students also viewed these Accounting questions