Answer using sci-kit learn
here is the dataset
https://www.kaggle.com/rush4ratio/video-game-sales-with-ratings

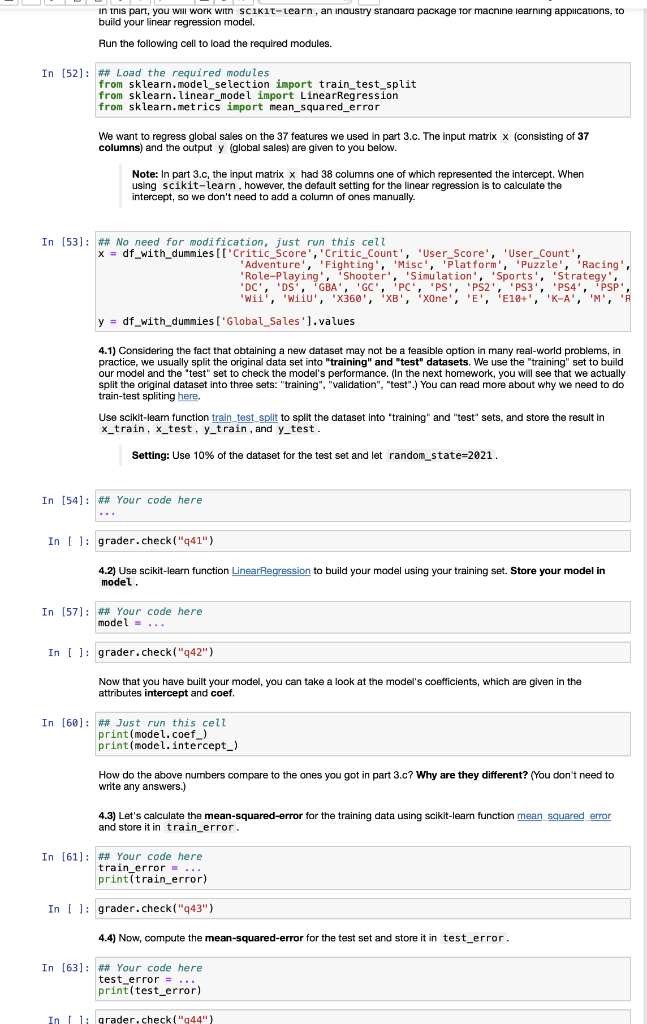
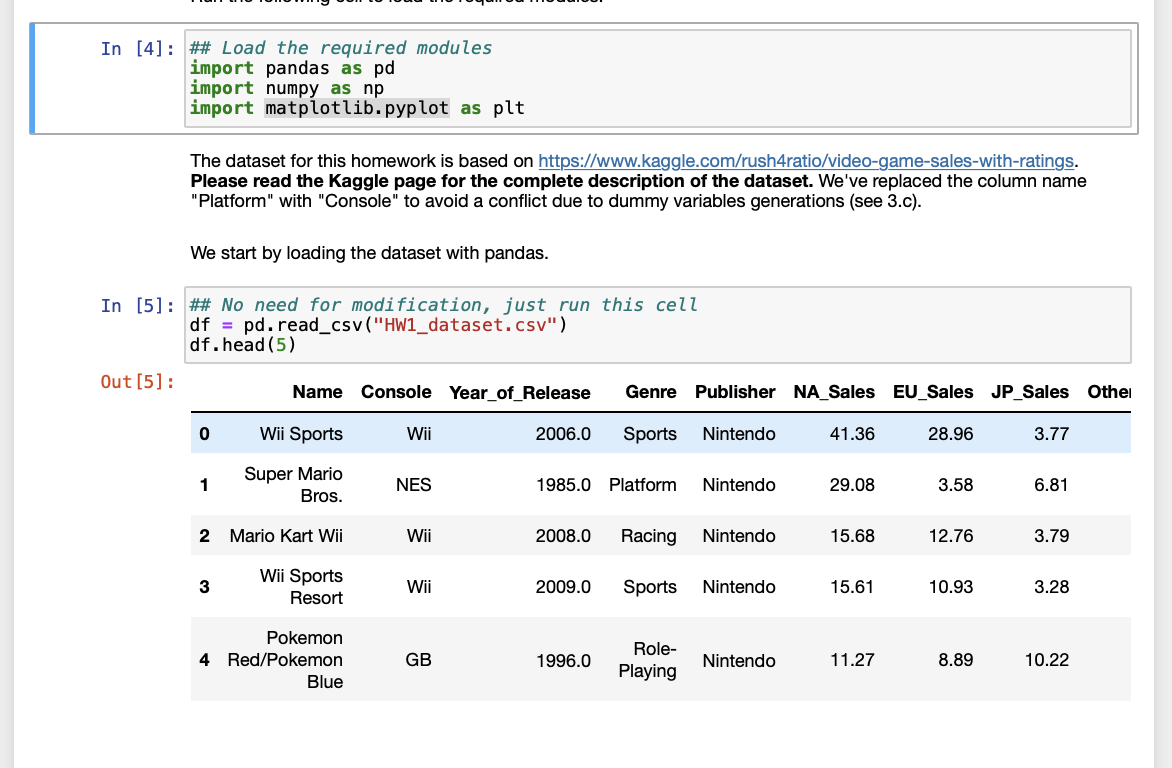
In this part, you will work with scikit-learn, an industry standard package for machine learning applications, to build your linear regression model. Run the following cell to load the required modules. In [52]: ## Load the required modules from sklearn.model_selection import train_test_split from sklearn. linear_model import LinearRegression from sklearn.metrics import mean_squared_error We want to regress global sales on the 37 features we used in part 3.c. The input matrix x (consisting of 37 columns) and the output y (global sales) are given to you below. Note: In part 3.c, the input matrix x had 38 columns one of which represented the intercept. When using scikit-learn, however, the default setting for the linear regression is to calculate the intercept, so we don't need to add a column of ones manually. In (53): ## No need for modification, just run this cell x = df_with_dummies [I'Critic score', 'Critic_count', 'User_Score', 'User_Count', 'Adventure', Fighting', 'Misc', 'Platform', 'Puzzle', 'Racing', 'Role-Playing', 'Shooter', 'Simulation', Sports', 'Strategy Wii, Wilu, XB, PC, PS, p$2,PS3 PS4, p ,''K-A, xone y = df_with_dummies ['Global_Sales').values 4.1) Considering the fact that obtaining a new dataset may not be a feasible option in many real-world problems, in practice, we usually split the original data set into "training" and "test" datasets. We use the "training" set to build our model and the test" set to check the model's performance. (In the next homework, you will see that we actually split the original dataset into three sets: "training", "validation", "test".) You can read more about why we need to do train-test spliting here. Use scikit-leam function train_test_split to split the dataset into training" and "test" sets, and store the result in x_train, x_test, y_train, and y_test Setting: Use 10% of the dataset for the test set and let random_state=2021. In [54]: ## Your code here In [ ]: grader.check("441") 4.2) Use Scikit-learn function LinearRegression to build your model using your training set. Store your model in model. In (57]: ## Your code here model ... In [ ]: grader.check("q42") Now that you have built your model, you can take a look at the model's coefficients, which are given in the attributes intercept and coef, In [60]: ## Just run this cell print(model.coef_) print(model. intercept) How do the above numbers compare to the ones you got in part 3.c? Why are they different? (You don't need to write any answers.) 4.3) Let's calculate the mean-squared-error for the training data using scikit-learn function mean squared error and store it in train_error. In [61]: ## Your code here train_error.... printtrain_error) In (): grader.check("443") 4.4) Now, compute the mean-squared-error for the test set and store it in test_error. In [63]: ## Your code here test_error = ... print(test_error) In 1: grader.check("244") In [4]: ## Load the required modules import pandas as pd import numpy as np import matplotlib.pyplot as plt The dataset for this homework is based on https://www.kaggle.com/rush4ratio/video-game-sales-with-ratings. Please read the Kaggle page for the complete description of the dataset. We've replaced the column name "Platform" with "Console" to avoid a conflict due to dummy variables generations (see 3.c). We start by loading the dataset with pandas. In [5]: ## No need for modification, just run this cell df = pd. read_csv ("HW1_dataset.csv") df.head (5) Out [5]: Name Console Year_of_Release Genre Publisher NA_Sales EU_Sales JP_Sales Other 0 Wii Sports Wii 2006.0 Sports Nintendo 41.36 28.96 3.77 1 Super Mario Bros. NES 1985.0 Platform Nintendo 29.08 3.58 6.81 2 Mario Kart Wii Wii 2008.0 Racing Nintendo 15.68 12.76 3.79 3 Wii Sports Resort Wii 2009.0 Sports Nintendo 15.61 10.93 3.28 Pokemon 4 Red/Pokemon Blue GB 1996.0 Role- Playing Nintendo 11.27 8.89 10.22 In this part, you will work with scikit-learn, an industry standard package for machine learning applications, to build your linear regression model. Run the following cell to load the required modules. In [52]: ## Load the required modules from sklearn.model_selection import train_test_split from sklearn. linear_model import LinearRegression from sklearn.metrics import mean_squared_error We want to regress global sales on the 37 features we used in part 3.c. The input matrix x (consisting of 37 columns) and the output y (global sales) are given to you below. Note: In part 3.c, the input matrix x had 38 columns one of which represented the intercept. When using scikit-learn, however, the default setting for the linear regression is to calculate the intercept, so we don't need to add a column of ones manually. In (53): ## No need for modification, just run this cell x = df_with_dummies [I'Critic score', 'Critic_count', 'User_Score', 'User_Count', 'Adventure', Fighting', 'Misc', 'Platform', 'Puzzle', 'Racing', 'Role-Playing', 'Shooter', 'Simulation', Sports', 'Strategy Wii, Wilu, XB, PC, PS, p$2,PS3 PS4, p ,''K-A, xone y = df_with_dummies ['Global_Sales').values 4.1) Considering the fact that obtaining a new dataset may not be a feasible option in many real-world problems, in practice, we usually split the original data set into "training" and "test" datasets. We use the "training" set to build our model and the test" set to check the model's performance. (In the next homework, you will see that we actually split the original dataset into three sets: "training", "validation", "test".) You can read more about why we need to do train-test spliting here. Use scikit-leam function train_test_split to split the dataset into training" and "test" sets, and store the result in x_train, x_test, y_train, and y_test Setting: Use 10% of the dataset for the test set and let random_state=2021. In [54]: ## Your code here In [ ]: grader.check("441") 4.2) Use Scikit-learn function LinearRegression to build your model using your training set. Store your model in model. In (57]: ## Your code here model ... In [ ]: grader.check("q42") Now that you have built your model, you can take a look at the model's coefficients, which are given in the attributes intercept and coef, In [60]: ## Just run this cell print(model.coef_) print(model. intercept) How do the above numbers compare to the ones you got in part 3.c? Why are they different? (You don't need to write any answers.) 4.3) Let's calculate the mean-squared-error for the training data using scikit-learn function mean squared error and store it in train_error. In [61]: ## Your code here train_error.... printtrain_error) In (): grader.check("443") 4.4) Now, compute the mean-squared-error for the test set and store it in test_error. In [63]: ## Your code here test_error = ... print(test_error) In 1: grader.check("244") In [4]: ## Load the required modules import pandas as pd import numpy as np import matplotlib.pyplot as plt The dataset for this homework is based on https://www.kaggle.com/rush4ratio/video-game-sales-with-ratings. Please read the Kaggle page for the complete description of the dataset. We've replaced the column name "Platform" with "Console" to avoid a conflict due to dummy variables generations (see 3.c). We start by loading the dataset with pandas. In [5]: ## No need for modification, just run this cell df = pd. read_csv ("HW1_dataset.csv") df.head (5) Out [5]: Name Console Year_of_Release Genre Publisher NA_Sales EU_Sales JP_Sales Other 0 Wii Sports Wii 2006.0 Sports Nintendo 41.36 28.96 3.77 1 Super Mario Bros. NES 1985.0 Platform Nintendo 29.08 3.58 6.81 2 Mario Kart Wii Wii 2008.0 Racing Nintendo 15.68 12.76 3.79 3 Wii Sports Resort Wii 2009.0 Sports Nintendo 15.61 10.93 3.28 Pokemon 4 Red/Pokemon Blue GB 1996.0 Role- Playing Nintendo 11.27 8.89 10.22


