
 Answered in Excel with formulas please
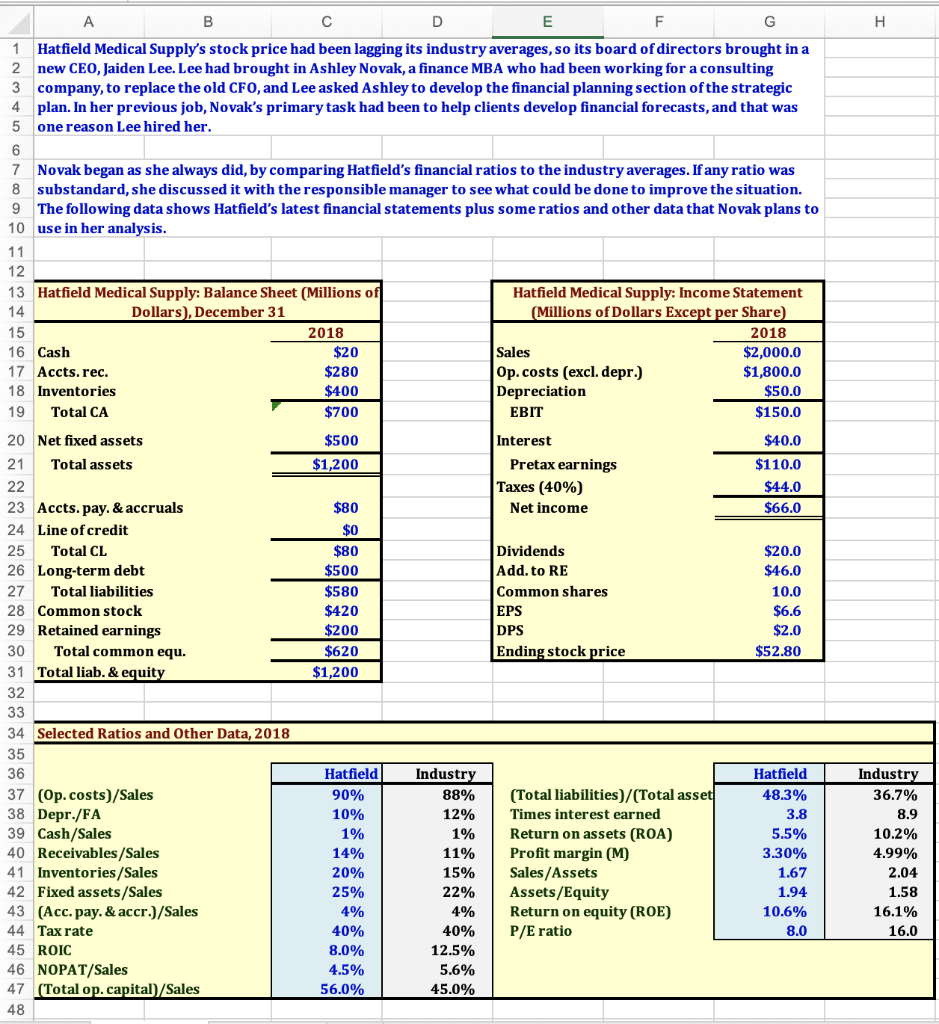
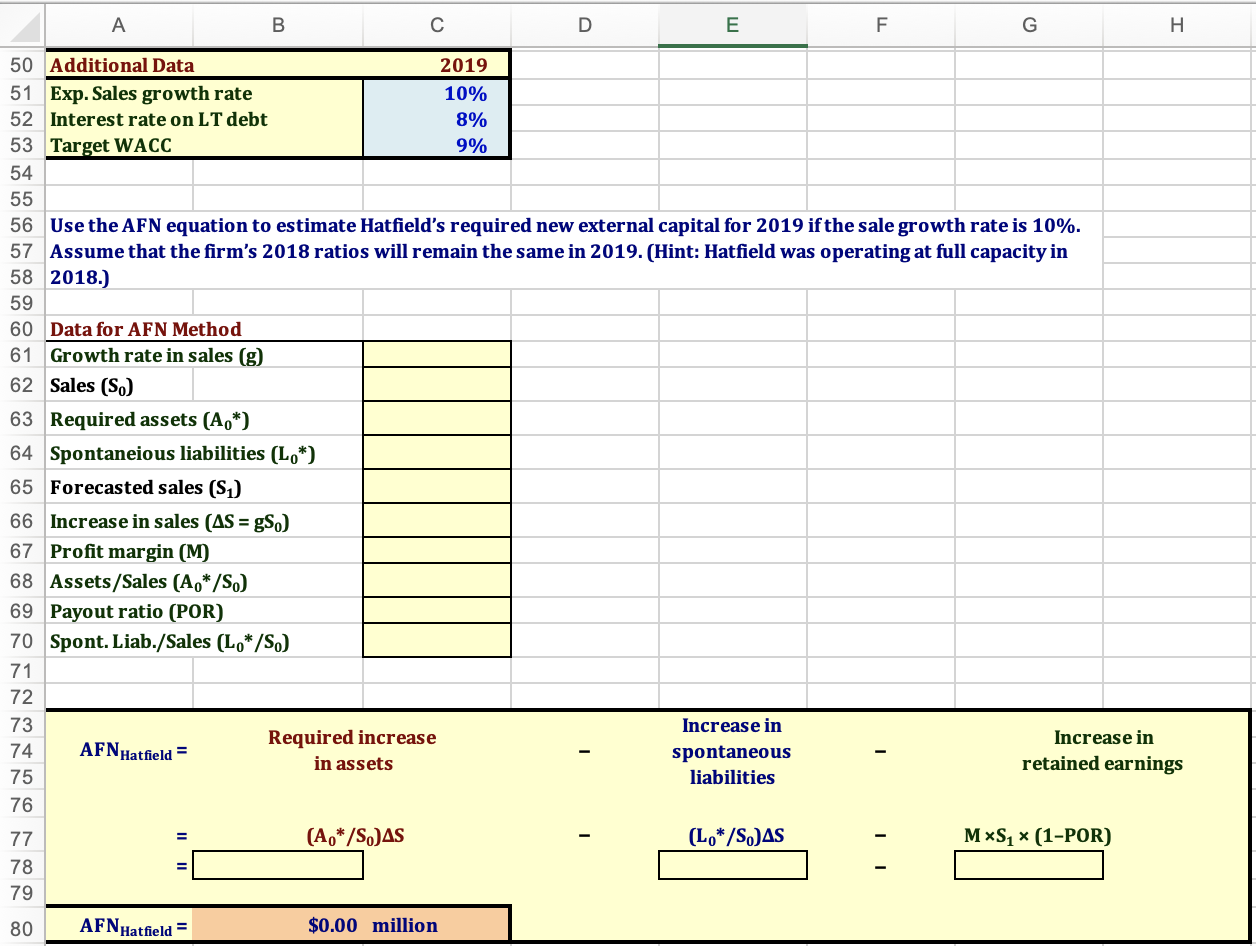
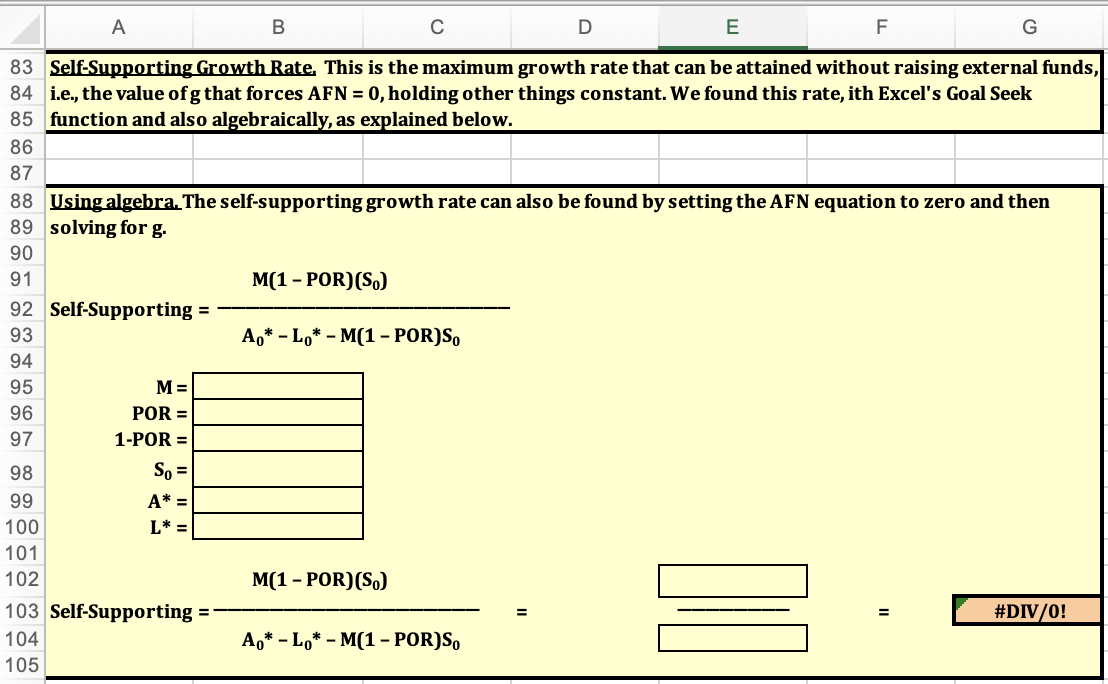
. B D E F Hatfield Medical Supply's stock price had been lagging its industry averages, so its board of directors brought in a 2 new CEO, Jaiden Lee. Lee had brought in Ashley Novak, a finance MBA who had been working for a consulting 3 company, to replace the old CFO, and Lee asked Ashley to develop the financial planning section of the strategic 4 plan. In her previous job, Novak's primary task had been to help clients develop financial forecasts, and that was 5 one reason Lee hired her. 6 7 Novak began as she always did, by comparing Hatfield's financial ratios to the industry averages. If any ratio was 8 substandard, she discussed it with the responsible manager to see what could be done to improve the situation. 9 The following data shows Hatfield's latest financial statements plus some ratios and other data that Novak plans to 10 use in her analysis. 11 12 13 Hatfield Medical Supply: Balance Sheet (Millions of Hatfield Medical Supply: Income Statement 14 Dollars), December 31 (Millions of Dollars Except per Share 15 2018 2018 16 Cash $20 Sales $2,000.0 17 Accts. rec. $280 Op.costs (excl. depr.) $1,800.0 18 Inventories $400 Depreciation $50.0 19 Total CA $700 EBIT $150.0 $500 $1,200 Interest Pretax earnings Taxes (40%) Net income $40.0 $110.0 $44.0 $66.0 $80 $0 $80 $500 $580 $420 $200 $620 $1,200 Dividends Add. to RE Common shares EPS DPS Ending stock price $20.0 $46.0 10.0 $6.6 $2.0 $52.80 20 Net fixed assets 21 Total assets 22 23 Accts.pay. & accruals 24 Line of credit 25 Total CL 26 Long-term debt 27 Total liabilities 28 Common stock 29 Retained earnings 30 Total common equ. 31 Total liab. & equity 32 33 34 Selected Ratios and Other Data, 2018 35 36 37 (Op.costs)/Sales 38 Depr./FA 39 Cash/Sales 40 Receivables/Sales 41 Inventories/Sales 42 Fixed assets/Sales 43 (Acc. pay. & accr.)/Sales 44 Tax rate 45 ROIC 46 NOPAT/Sales 47 (Total op. capital)/Sales 48 Hatfield 90% 10% 1% 14% 20% 25% 4% 40% 8.0% 4.5% 56.0% Industry 88% 12% 1% 11% 15% 22% 4% 40% 12.5% 5.6% 45.0% (Total liabilities)/(Total asset Times interest earned Return on assets (ROA) Profit margin (M) Sales/Assets Assets/Equity Return on equity (ROE) P/E ratio Hatfield 48.3% 3.8 5.5% 3.30% 1.67 1.94 10.6% 8.0 Industry 36.7% 8.9 10.2% 4.99% 2.04 1.58 16.1% 16.0 A B D E F G . 50 Additional Data 2019 51 Exp. Sales growth rate 10% 52 Interest rate on LT debt 8% 53 Target WACC 9% 54 55 56 Use the AFN equation to estimate Hatfield's required new external capital for 2019 if the sale growth rate is 10%. 57 Assume that the firm's 2018 ratios will remain the same in 2019. (Hint: Hatfield was operating at full capacity in 58 2018.) 59 60 Data for AFN Method 61 Growth rate in sales (g) 62 Sales (S.) 63 Required assets (A.*) 64 Spontaneious liabilities (L.*) 65 Forecasted sales (SD) 66 Increase in sales (AS = gs.) 67 Profit margin (M) 68 Assets/Sales (A.* /S.) 69 Payout ratio (POR) 70 Spont. Liab./Sales (Lo*/S.) 71 72 73 Increase in Required increase Increase in 74 AFN Hatfield = spontaneous in assets retained earnings 75 liabilities 76 77 (A,*/S. AS (Lo*/S.AS MS_(1-POR) 78 79 80 AFNHatfield = $0.00 million A B D E F G 83 Self-Supporting Growth Rate. This is the maximum growth rate that can be attained without raising external funds, 84 i.e., the value ofg that forces AFN = 0, holding other things constant. We found this rate, ith Excel's Goal Seek 85 function and also algebraically, as explained below. 86 87 88 Using algebra. The self-supporting growth rate can also be found by setting the AFN equation to zero and then 89 solving for g. 90 91 M(1 - POR) (S.) 92 Self-Supporting = 93 A.* - Lo* - M(1 - POR)S. 94 95 M= 96 POR = 97 1-POR = 98 So = 99 A* = 100 L* = 101 102 M(1 - POR)(S.) 103 Self-Supporting = #DIV/0! 104 Ac* - Lo* - M(1 - PORS. 105 = . B D E F Hatfield Medical Supply's stock price had been lagging its industry averages, so its board of directors brought in a 2 new CEO, Jaiden Lee. Lee had brought in Ashley Novak, a finance MBA who had been working for a consulting 3 company, to replace the old CFO, and Lee asked Ashley to develop the financial planning section of the strategic 4 plan. In her previous job, Novak's primary task had been to help clients develop financial forecasts, and that was 5 one reason Lee hired her. 6 7 Novak began as she always did, by comparing Hatfield's financial ratios to the industry averages. If any ratio was 8 substandard, she discussed it with the responsible manager to see what could be done to improve the situation. 9 The following data shows Hatfield's latest financial statements plus some ratios and other data that Novak plans to 10 use in her analysis. 11 12 13 Hatfield Medical Supply: Balance Sheet (Millions of Hatfield Medical Supply: Income Statement 14 Dollars), December 31 (Millions of Dollars Except per Share 15 2018 2018 16 Cash $20 Sales $2,000.0 17 Accts. rec. $280 Op.costs (excl. depr.) $1,800.0 18 Inventories $400 Depreciation $50.0 19 Total CA $700 EBIT $150.0 $500 $1,200 Interest Pretax earnings Taxes (40%) Net income $40.0 $110.0 $44.0 $66.0 $80 $0 $80 $500 $580 $420 $200 $620 $1,200 Dividends Add. to RE Common shares EPS DPS Ending stock price $20.0 $46.0 10.0 $6.6 $2.0 $52.80 20 Net fixed assets 21 Total assets 22 23 Accts.pay. & accruals 24 Line of credit 25 Total CL 26 Long-term debt 27 Total liabilities 28 Common stock 29 Retained earnings 30 Total common equ. 31 Total liab. & equity 32 33 34 Selected Ratios and Other Data, 2018 35 36 37 (Op.costs)/Sales 38 Depr./FA 39 Cash/Sales 40 Receivables/Sales 41 Inventories/Sales 42 Fixed assets/Sales 43 (Acc. pay. & accr.)/Sales 44 Tax rate 45 ROIC 46 NOPAT/Sales 47 (Total op. capital)/Sales 48 Hatfield 90% 10% 1% 14% 20% 25% 4% 40% 8.0% 4.5% 56.0% Industry 88% 12% 1% 11% 15% 22% 4% 40% 12.5% 5.6% 45.0% (Total liabilities)/(Total asset Times interest earned Return on assets (ROA) Profit margin (M) Sales/Assets Assets/Equity Return on equity (ROE) P/E ratio Hatfield 48.3% 3.8 5.5% 3.30% 1.67 1.94 10.6% 8.0 Industry 36.7% 8.9 10.2% 4.99% 2.04 1.58 16.1% 16.0 A B D E F G . 50 Additional Data 2019 51 Exp. Sales growth rate 10% 52 Interest rate on LT debt 8% 53 Target WACC 9% 54 55 56 Use the AFN equation to estimate Hatfield's required new external capital for 2019 if the sale growth rate is 10%. 57 Assume that the firm's 2018 ratios will remain the same in 2019. (Hint: Hatfield was operating at full capacity in 58 2018.) 59 60 Data for AFN Method 61 Growth rate in sales (g) 62 Sales (S.) 63 Required assets (A.*) 64 Spontaneious liabilities (L.*) 65 Forecasted sales (SD) 66 Increase in sales (AS = gs.) 67 Profit margin (M) 68 Assets/Sales (A.* /S.) 69 Payout ratio (POR) 70 Spont. Liab./Sales (Lo*/S.) 71 72 73 Increase in Required increase Increase in 74 AFN Hatfield = spontaneous in assets retained earnings 75 liabilities 76 77 (A,*/S. AS (Lo*/S.AS MS_(1-POR) 78 79 80 AFNHatfield = $0.00 million A B D E F G 83 Self-Supporting Growth Rate. This is the maximum growth rate that can be attained without raising external funds, 84 i.e., the value ofg that forces AFN = 0, holding other things constant. We found this rate, ith Excel's Goal Seek 85 function and also algebraically, as explained below. 86 87 88 Using algebra. The self-supporting growth rate can also be found by setting the AFN equation to zero and then 89 solving for g. 90 91 M(1 - POR) (S.) 92 Self-Supporting = 93 A.* - Lo* - M(1 - POR)S. 94 95 M= 96 POR = 97 1-POR = 98 So = 99 A* = 100 L* = 101 102 M(1 - POR)(S.) 103 Self-Supporting = #DIV/0! 104 Ac* - Lo* - M(1 - PORS. 105 =


 Answered in Excel with formulas please


