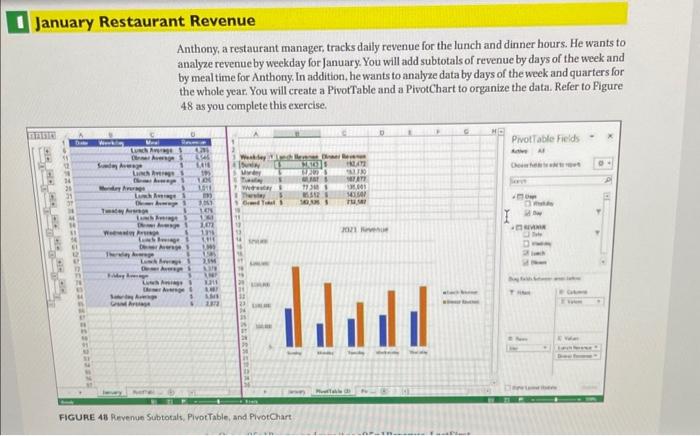
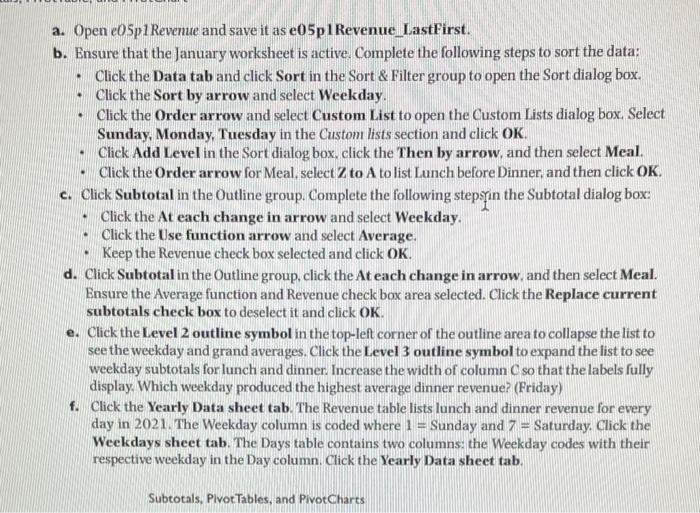
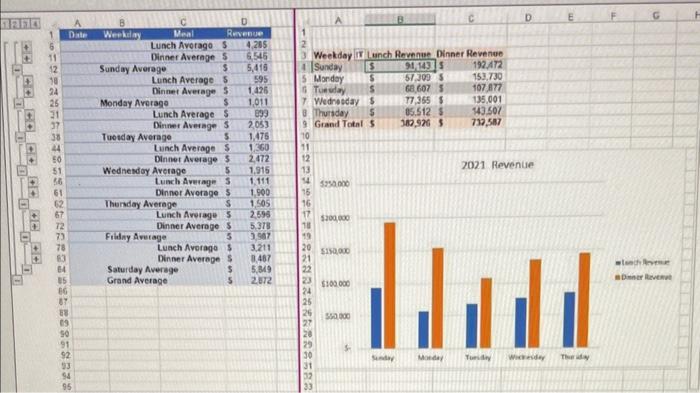
Anthony, a restaurant manager, tracks daily revenue for the lunch and dinner hours. He wants to analyze revenue by weekday for January. You will add subtotals of revenue by days of the week and by meal time for Anthony. In addition, he wants to analyze data by days of the week and quarters for the whole year. You will create a PivotTable and a PivotChart to organize the data. Refer to Figure 48 as you complete this exercise. FiGURE 48 Revenue Subtocals, PivotTable, and PivotChart a. Open e05p1Revemue and save it as e05p 1 Revenue_LastFirst. b. Ensure that the January worksheet is active. Complete the following steps to sort the data: - Click the Data tab and click Sort in the Sort \& Filter group to open the Sort dialog box. - Click the Sort by arrow and select Weekday. - Click the Order arrow and select Custom List to open the Custom Lists dialog box. Select Sunday, Monday, Tuesday in the Custom lists section and click OK. - Click Add Level in the Sort dialog box, click the Then by arrow, and then select Meal. - Click the Order arrow for Meal, select Z to A to list Lunch before Dinner, and then click OK. c. Click Subtotal in the Outline group. Complete the following stepsin the Subtotal dialog box: - Click the At each change in arrow and select Weekday. - Click the Use function arrow and select Average. - Keep the Revenue check box selected and click OK. d. Click Subtotal in the Outline group, click the At each change in arrow, and then select Meal. Ensure the Average function and Revenue check box area selected. Click the Replace current subtotals check box to deselect it and click OK. e. Click the Level 2 outline symbol in the top-left corner of the outline area to collapse the list to see the weekday and grand averages. Click the Level 3 outline symbol to expand the list to see weekday subtotals for lunch and dinner. Increase the width of column C so that the labels fully display. Which weekday produced the highest average dinner revenue? (Friday) f. Click the Yearly Data sheet tab. The Revenue table lists lunch and dinner revenue for every day in 2021. The Weekday column is coded where 1= Sunday and 7= Saturday. Click the Weekdays sheet tab. The Days table contains two columns: the Weekday codes with their respective weekday in the Day column. Click the Yearly Data sheet tab. 72 73 78 63 84 65 66 67 58 69 50 91 92 53 94 95 Saturday Aversge Grand Average (4) $102000 seapo - tendintar - Dwerer irevenat


