Answered step by step
Verified Expert Solution
Link Copied!

Question

1 Approved Answer

any help please question 8 Actual Expected Games Played _ Expected Frequency Contests Proportion 4 15 1% l l 5 19 1% l l 6

any help please question 8
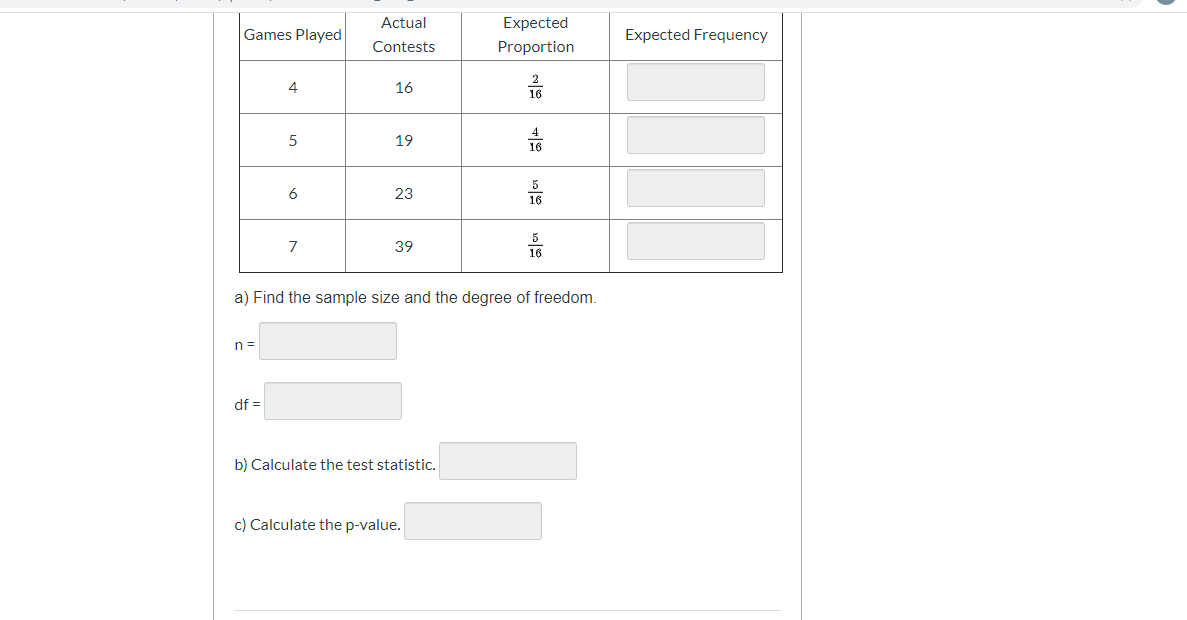
image text in transcribedimage text in transcribed
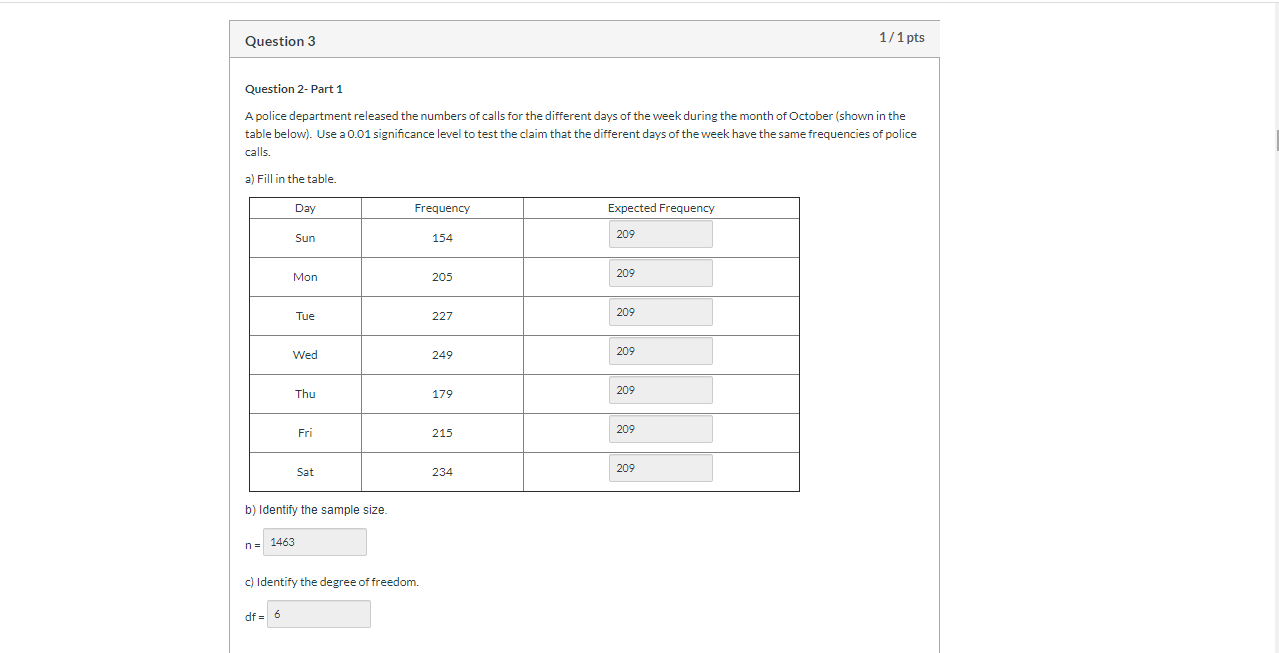
Actual Expected Games Played _ Expected Frequency Contests Proportion 4 15 1% l l 5 19 1% l l 6 23 1% l l 7 39 1% l ' 21) Find the sample size and the degree of freedom. df b} Calculate the test statistic. (2) Calculate the pvalue. Question 3 1/1 pts Question 2- Part 1 A police department released the numbers of calls for the different days of the week during the month of October (shown in the table below). Use a 0.01 significance level to test the claim that the different days of the week have the same frequencies of police calls. 2) Fill in the table. Day Frequency Expected Frequency Sun 154 209 Mon 205 209 Tue 227 209 Wed 249 209 Thu 179 209 Fri 215 209 Sat 234 209 b) Identify the sample size. n= 1463 c) Identify the degree of freedom. df = 6

Step by Step Solution

There are 3 Steps involved in it

Step: 1

blur-text-image

Get Instant Access to Expert-Tailored Solutions

See step-by-step solutions with expert insights and AI powered tools for academic success

Step: 2

blur-text-image_2

Step: 3

blur-text-image_3

Ace Your Homework with AI

Get the answers you need in no time with our AI-driven, step-by-step assistance

Get Started

Recommended Textbook for

Quantitative Analysis For Management

Authors: Barry Render, Ralph M. Stair, Michael E. Hanna

11th Edition

9780132997621, 132149117, 132997622, 978-0132149112

Students also viewed these Mathematics questions