 Any help with a-c and the formulas that are needed would be greatly appreciated
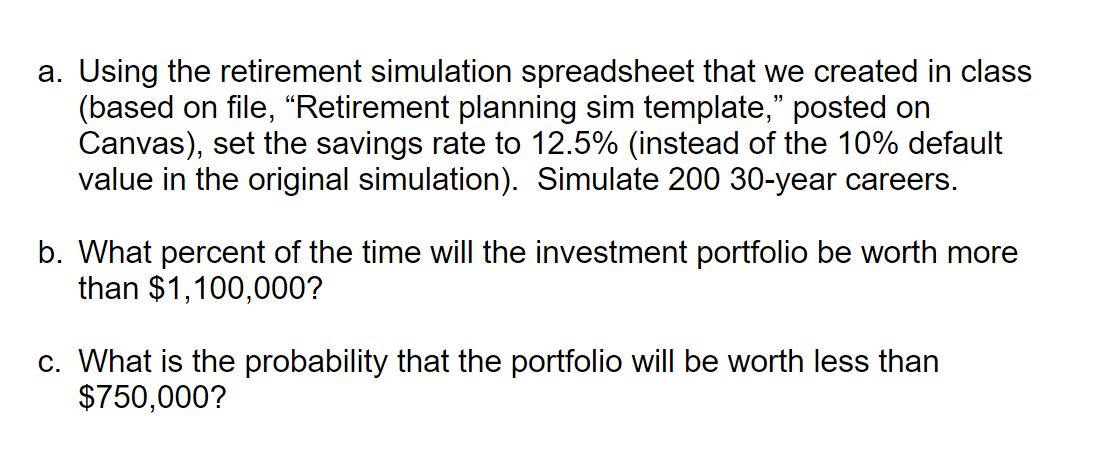
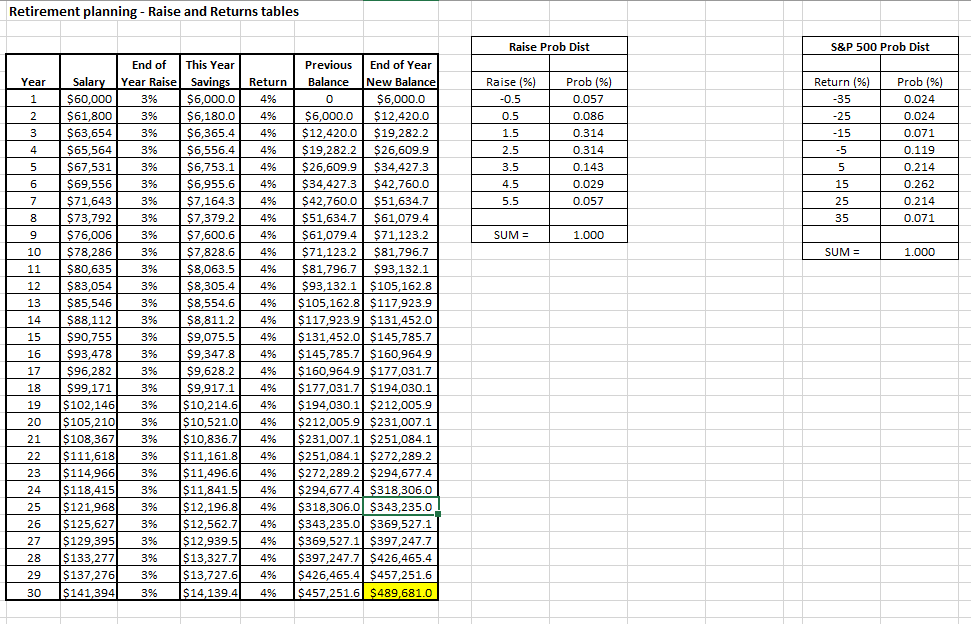
" a. Using the retirement simulation spreadsheet that we created in class (based on file, Retirement planning sim template," posted on Canvas), set the savings rate to 12.5% (instead of the 10% default value in the original simulation). Simulate 200 30-year careers. b. What percent of the time will the investment portfolio be worth more than $1,100,000? c. What is the probability that the portfolio will be worth less than $750,000? Retirement planning - Raise and Returns tables Raise Prob Dist S&P 500 Prob Dist Year 1 2 Return 4% 4% 4 4% 3 Raise (%) -0.5 0.5 1.5 2.5 3.5 4.5 5.5 Prob (%) 0.057 0.086 0.314 0.314 0.143 0.029 0.057 4 49 Return (%) -35 -25 -15 -5 5 15 25 35 Prob (%) 0.024 0.024 0.071 0.119 0.214 0.262 0.214 0.071 496 4% 4% 4% 4% SUM = 1.000 5 5 6 6 7 7 8 9 9 10 11 12 13 14 15 SUM= 1.000 4% 496 494 4% 496 End of This Year Salary Year Raise Savings $60,000 3% $6,000.0 $61,800 3% $6,180.0 $63,654 3% $6,365.4 $65,564 3% $6,556.4 $67,531 3% $6,753.1 $69,556 3% $6,955.6 $71,643 3% $7,164.3 $73,792 3% $7,379.2 $76,006 3% $7,600.6 $78,286 3% $7,828.6 $80,635 3% $8,063. $83,054 3% $8,305.4 $85,546 3% $8,554.6 $88,112 3% $8,811.2 $90,755 3% $9,075.5 $93,478 3% $9,347.8 $96.282 3% $9,628.2 $99,171 3% $9,917.1 $102,146 3% $10,214.6 $ 105,210 3% $10,521. $108,367 3% $10,836.7 $111,618) 3% $11,161. $ 114,966 3% $11,496.6 $118,415 3% $11,841.5 $121,968 3% $12,196.8 $125,627 3% $12,562.7 $129,395 3% $12,939.5 $133,277 3% $13,327.7 $137.276 3% 3 $13,727.6 $141,394 3% $14,139.4 Previous End of Year Balance New Balance 0 $6,000.0 $6,000.0 $12,420.0 $12,420.0 $19,282.2 $19,282.2 $26,609.9 $26,609,9 $34,427.3 $34,427.3 $42,760.0 $42,760.0 $51,634.7 $51,634.7 $61,079.4 $61,079.4 $71,123.2 $71,123.2 $81,796.7 $81,796.7 $93.132.1 $93,132.1 $105,162.8 $105,162.8 $117,923.9 $117,923.91 $131,452.0 $131,452.00 $145,785.7 $145,785.71 $160,964.9 $160,964.9 $177,031.7 $177,031.7 $194,030.1 $194,030.1 $212,005.9 $212,005.9 $231,007.1 $231,007.1 $251,084.1 $251,084.1 $272,289.2 $ 272,289.2 $294.677.4 $294,677.4 $318,306.0 $318,306.00 $343,235.0 $343,235.0 $369,527.1 $369,527.1 $397,247.7 $397,247.71 $426,465.4 $426,465.4 $457,251.6 $457,251.6 $489,681.0 4% 4% 4% 4% 4% 49 16 17 18 19 20 21 22 23 24 25 496 4% 4% 494 26 % 494 494 4% 4% 27 4% 28 29 30 4% 4% " a. Using the retirement simulation spreadsheet that we created in class (based on file, Retirement planning sim template," posted on Canvas), set the savings rate to 12.5% (instead of the 10% default value in the original simulation). Simulate 200 30-year careers. b. What percent of the time will the investment portfolio be worth more than $1,100,000? c. What is the probability that the portfolio will be worth less than $750,000? Retirement planning - Raise and Returns tables Raise Prob Dist S&P 500 Prob Dist Year 1 2 Return 4% 4% 4 4% 3 Raise (%) -0.5 0.5 1.5 2.5 3.5 4.5 5.5 Prob (%) 0.057 0.086 0.314 0.314 0.143 0.029 0.057 4 49 Return (%) -35 -25 -15 -5 5 15 25 35 Prob (%) 0.024 0.024 0.071 0.119 0.214 0.262 0.214 0.071 496 4% 4% 4% 4% SUM = 1.000 5 5 6 6 7 7 8 9 9 10 11 12 13 14 15 SUM= 1.000 4% 496 494 4% 496 End of This Year Salary Year Raise Savings $60,000 3% $6,000.0 $61,800 3% $6,180.0 $63,654 3% $6,365.4 $65,564 3% $6,556.4 $67,531 3% $6,753.1 $69,556 3% $6,955.6 $71,643 3% $7,164.3 $73,792 3% $7,379.2 $76,006 3% $7,600.6 $78,286 3% $7,828.6 $80,635 3% $8,063. $83,054 3% $8,305.4 $85,546 3% $8,554.6 $88,112 3% $8,811.2 $90,755 3% $9,075.5 $93,478 3% $9,347.8 $96.282 3% $9,628.2 $99,171 3% $9,917.1 $102,146 3% $10,214.6 $ 105,210 3% $10,521. $108,367 3% $10,836.7 $111,618) 3% $11,161. $ 114,966 3% $11,496.6 $118,415 3% $11,841.5 $121,968 3% $12,196.8 $125,627 3% $12,562.7 $129,395 3% $12,939.5 $133,277 3% $13,327.7 $137.276 3% 3 $13,727.6 $141,394 3% $14,139.4 Previous End of Year Balance New Balance 0 $6,000.0 $6,000.0 $12,420.0 $12,420.0 $19,282.2 $19,282.2 $26,609.9 $26,609,9 $34,427.3 $34,427.3 $42,760.0 $42,760.0 $51,634.7 $51,634.7 $61,079.4 $61,079.4 $71,123.2 $71,123.2 $81,796.7 $81,796.7 $93.132.1 $93,132.1 $105,162.8 $105,162.8 $117,923.9 $117,923.91 $131,452.0 $131,452.00 $145,785.7 $145,785.71 $160,964.9 $160,964.9 $177,031.7 $177,031.7 $194,030.1 $194,030.1 $212,005.9 $212,005.9 $231,007.1 $231,007.1 $251,084.1 $251,084.1 $272,289.2 $ 272,289.2 $294.677.4 $294,677.4 $318,306.0 $318,306.00 $343,235.0 $343,235.0 $369,527.1 $369,527.1 $397,247.7 $397,247.71 $426,465.4 $426,465.4 $457,251.6 $457,251.6 $489,681.0 4% 4% 4% 4% 4% 49 16 17 18 19 20 21 22 23 24 25 496 4% 4% 494 26 % 494 494 4% 4% 27 4% 28 29 30 4% 4%