Any help with these would be appreciated! Thank you!!


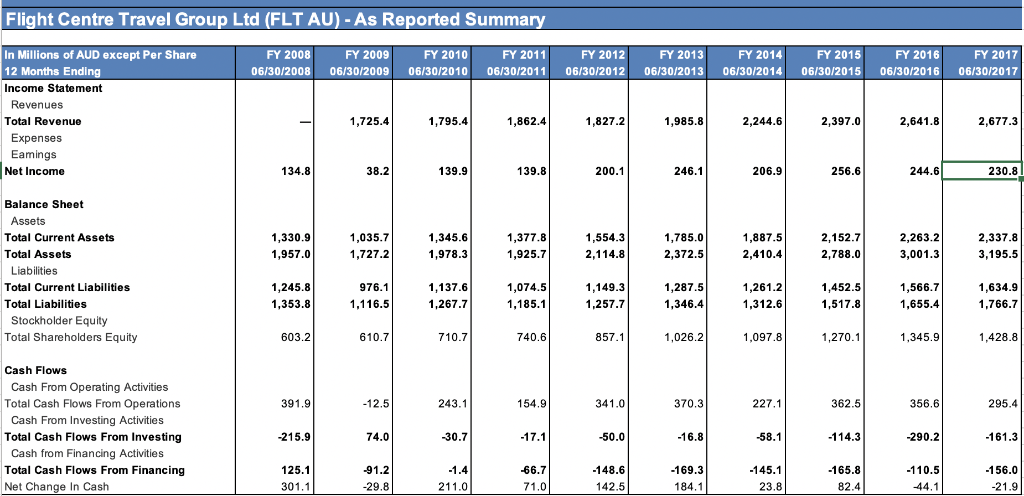
These are the given data sets:

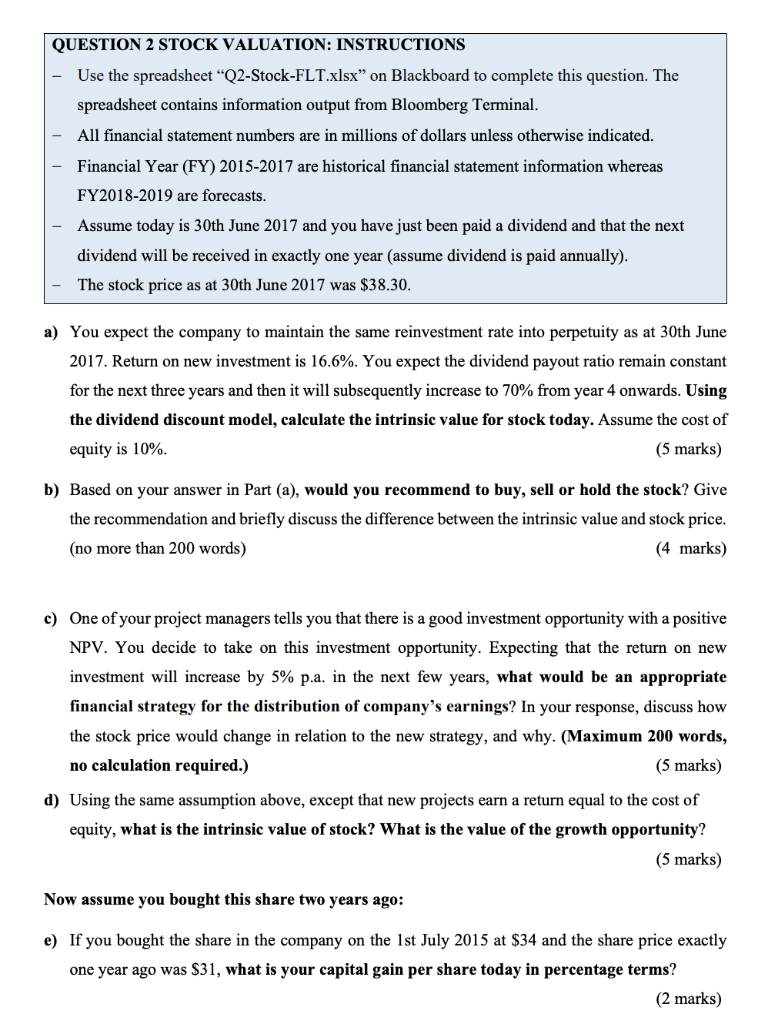
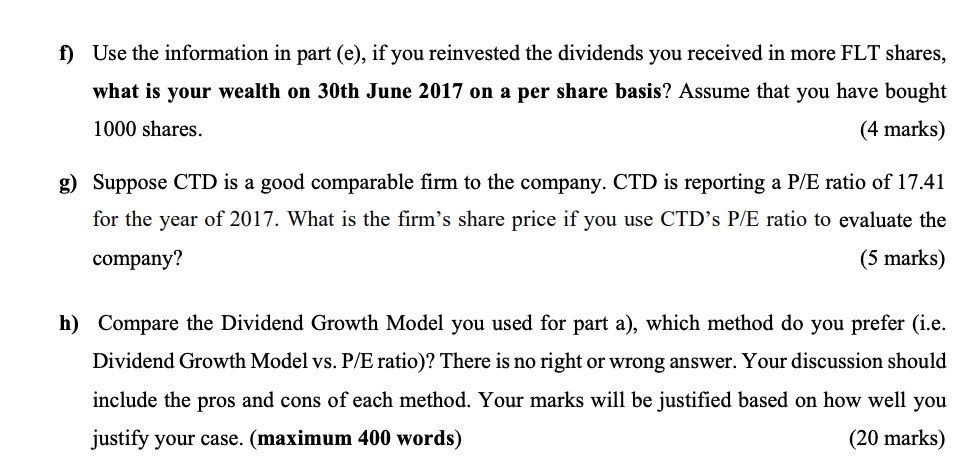
QUESTION 2 STOCK VALUATION: INSTRUCTIONS Use the spreadsheet "Q2-Stock-FLT.xlsx" on Blackboard to complete this question. The spreadsheet contains information output from Bloomberg Terminal All financial statement numbers are in millions of dollars unless otherwise indicated Financial Year (FY) 2015-2017 are historical financial statement information whereas FY2018-2019 are forecasts. Assume today is 30th June 2017 and you have just been paid a dividend and that the next dividend will be received in exactly one year (assume dividend is paid annually) The stock price as at 30th June 2017 was $38.30 - a) You expect the company to maintain the same reinvestment rate into perpetuity as at 30th June 2017, Return on new investment is 16.6%. You expect the dividend payout ratio remain constant for the next three years and then it will subsequently increase to 70% from year 4 onwards. Using the dividend discount model, calculate the intrinsic value for stock today. Assume the cost of (5 marks) b) Based on your answer in Part (a), would you recommend to buy, sell or hold the stock? Give the recommendation and briefly discuss the difference between the intrinsic value and stock price (4 marks) equity is 10% (no more than 200 words) c) One ofyour project managers tells you that there is a good investment opportunity with a positive NPV. You decide to take on this investment opportunity. Expecting that the return on new investment will increase by 5% pa. in the next few years, what would be an appropriate financial strategy for the distribution of company's earnings? In your response, discuss how the stock price would change in relation to the new strategy, and why. (Maximum 200 words, no calculation required.) (5 marks) d) Using the same assumption above, except that new projects earn a return equal to the cost of equity, what is the intrinsic value of stock? What is the value of the growth opportunity? (5 marks) Now assume you bought this share two years ago: e) If you bought the share in the company on the 1st July 2015 at $34 and the share price exactly one year ago was S31, what is your capital gain per share today in percentage terms? (2 marks) f) Use the information in part (e), if you reinvested the dividends you received in more FLT shares, what is your wealth on 30th June 2017 on a per share basis? Assume that you have bought (4 marks) g Suppose CTD is a good comparable firm to the company. CTD is reporting a P/E ratio of 17.41 for the year of 2017. What is the firm's share price if you use CTD's P/E ratio to evaluate the (5 marks) 1000 shares company? h) Compare the Dividend Growth Model you used for part a), which method do you prefer (i.e. Dividend Growth Model vs. P/E ratio)? There is no right or wrong answer. Your discussion should include the pros and cons of each method. Your marks will be justified based on how well you (20 marks) justify your case. (maximum 400 words) Flight Centre Travel Group Ltd (FLT AU) -As Reported Summary FY 2017 06/30/2008 06/30/2009 06/30/201006/30/201106/30/201206/30/2013 06/30/2014 06/30/2015 06/30/2016 06/30/2017 FY 2011 FY 2012 FY 2014 FY 2016 FY 2010 FY 2015 In Millions of AUD except Per Share 12 Months Ending Income Statement FY 2008 FY 2009 FY 2013 Revenues Total Revenue 1,985.8 2,244.6 2,641.8 1,725.4 1,795.4 1,862.4 1,827.2 2,397.0 2,677.3 Expenses Eamings Net Income 134.8 244.6 139.8 206.9 256.6 230.8 Balance Sheet Assets Total Current Assets Total Assets 1,330.9 1,957.0 1,035.7 1,727.2 1,887.5 1,785.0 2,372.5 1,345.6 1,978.3 1,377.8 1,925.7 1,554.3 2,152.7 2,788.0 2,263.2 3,001.3 2,337.8 3,195.5 Liabilities Total Current Liabilities Total Liabilities 1,245.8 1,353.8 1,137.6 1,074.5 1,185.1 1,149.3 1,566.7 1,655.4 976.1 1,287.5 1,346.4 1,261.2 1,312.6 1,634.9 1,766.7 Stockholder Equity Total Shareholders Equity 1,428.8 1,026.2 603.2 857.1 1,097.8 Cash Flows Cash From Operating Activities Total Cash Flows From Operations Cash From Investing Activities Total Cash Flows From Investing Cash from Financing Activitie Total Cash Flows From Financing 391.9 243.1 370.3 227.1 362.5 356.6 295.4 -290.2 161.3 Net Change In Cash 301.1 142.5 Flight Centre Travel Group Ltd (FLT AU) - Dividend Summary FY 2010 FY 2011 FY 2012 FY 2014 FY 2016 FY 2015 In Millions of AUD except Per Share 12 Months Ending Dividends per Share Dividends per Share 5 Yr Geo Growth Dividend Yield Dividend Payout Ratio Cash Dividend Coverage Dividends Paid Total Cash Preferred Dividends Total Cash Common Dividends Trailing 12M Prefered Dividends Trailing 12M Common Dividends Trailing 12M Dividends Per Share FY 2017 06/30/2010 06/30/2011 06/30/2012 06/30/2013 06/30/2014 06/30/2015 06/30/2016 06/30/2017 1.39 4.4141 3.577 60.8399 1.6437 -138.3 0.0 140.4 FY 2013 1.52 76.0031 3.2846 73.879 1.3536 146.8 0.0 152.9 0.0 152.9 1.52 1.52 16.7748 4.4562 59.7343 1.6741 153.1 0.0 153.3 0.0 153.3 1.52 0.84 1.12 1.37 1.52 12.5934 4.9715 62.7218 1.5943 158.4 0.0 153.4 0.0 153.4 1.52 1.5634 49.9374 2.0025 25.9 0.0 69.8 4.7015 56.008 1.7855 89.0 0.0 112.1 3.7003 60.0536 1.6652 79.9 2.9748 55.9101 1.7886 0.0 137.6 0.0 137.6 1.37 84.0 0.0 84.0 0.84 140.4 1.39 69.8 0.7 112.1 1.12 QUESTION 2 STOCK VALUATION: INSTRUCTIONS Use the spreadsheet "Q2-Stock-FLT.xlsx" on Blackboard to complete this question. The spreadsheet contains information output from Bloomberg Terminal All financial statement numbers are in millions of dollars unless otherwise indicated Financial Year (FY) 2015-2017 are historical financial statement information whereas FY2018-2019 are forecasts. Assume today is 30th June 2017 and you have just been paid a dividend and that the next dividend will be received in exactly one year (assume dividend is paid annually) The stock price as at 30th June 2017 was $38.30 - a) You expect the company to maintain the same reinvestment rate into perpetuity as at 30th June 2017, Return on new investment is 16.6%. You expect the dividend payout ratio remain constant for the next three years and then it will subsequently increase to 70% from year 4 onwards. Using the dividend discount model, calculate the intrinsic value for stock today. Assume the cost of (5 marks) b) Based on your answer in Part (a), would you recommend to buy, sell or hold the stock? Give the recommendation and briefly discuss the difference between the intrinsic value and stock price (4 marks) equity is 10% (no more than 200 words) c) One ofyour project managers tells you that there is a good investment opportunity with a positive NPV. You decide to take on this investment opportunity. Expecting that the return on new investment will increase by 5% pa. in the next few years, what would be an appropriate financial strategy for the distribution of company's earnings? In your response, discuss how the stock price would change in relation to the new strategy, and why. (Maximum 200 words, no calculation required.) (5 marks) d) Using the same assumption above, except that new projects earn a return equal to the cost of equity, what is the intrinsic value of stock? What is the value of the growth opportunity? (5 marks) Now assume you bought this share two years ago: e) If you bought the share in the company on the 1st July 2015 at $34 and the share price exactly one year ago was S31, what is your capital gain per share today in percentage terms? (2 marks) f) Use the information in part (e), if you reinvested the dividends you received in more FLT shares, what is your wealth on 30th June 2017 on a per share basis? Assume that you have bought (4 marks) g Suppose CTD is a good comparable firm to the company. CTD is reporting a P/E ratio of 17.41 for the year of 2017. What is the firm's share price if you use CTD's P/E ratio to evaluate the (5 marks) 1000 shares company? h) Compare the Dividend Growth Model you used for part a), which method do you prefer (i.e. Dividend Growth Model vs. P/E ratio)? There is no right or wrong answer. Your discussion should include the pros and cons of each method. Your marks will be justified based on how well you (20 marks) justify your case. (maximum 400 words) Flight Centre Travel Group Ltd (FLT AU) -As Reported Summary FY 2017 06/30/2008 06/30/2009 06/30/201006/30/201106/30/201206/30/2013 06/30/2014 06/30/2015 06/30/2016 06/30/2017 FY 2011 FY 2012 FY 2014 FY 2016 FY 2010 FY 2015 In Millions of AUD except Per Share 12 Months Ending Income Statement FY 2008 FY 2009 FY 2013 Revenues Total Revenue 1,985.8 2,244.6 2,641.8 1,725.4 1,795.4 1,862.4 1,827.2 2,397.0 2,677.3 Expenses Eamings Net Income 134.8 244.6 139.8 206.9 256.6 230.8 Balance Sheet Assets Total Current Assets Total Assets 1,330.9 1,957.0 1,035.7 1,727.2 1,887.5 1,785.0 2,372.5 1,345.6 1,978.3 1,377.8 1,925.7 1,554.3 2,152.7 2,788.0 2,263.2 3,001.3 2,337.8 3,195.5 Liabilities Total Current Liabilities Total Liabilities 1,245.8 1,353.8 1,137.6 1,074.5 1,185.1 1,149.3 1,566.7 1,655.4 976.1 1,287.5 1,346.4 1,261.2 1,312.6 1,634.9 1,766.7 Stockholder Equity Total Shareholders Equity 1,428.8 1,026.2 603.2 857.1 1,097.8 Cash Flows Cash From Operating Activities Total Cash Flows From Operations Cash From Investing Activities Total Cash Flows From Investing Cash from Financing Activitie Total Cash Flows From Financing 391.9 243.1 370.3 227.1 362.5 356.6 295.4 -290.2 161.3 Net Change In Cash 301.1 142.5 Flight Centre Travel Group Ltd (FLT AU) - Dividend Summary FY 2010 FY 2011 FY 2012 FY 2014 FY 2016 FY 2015 In Millions of AUD except Per Share 12 Months Ending Dividends per Share Dividends per Share 5 Yr Geo Growth Dividend Yield Dividend Payout Ratio Cash Dividend Coverage Dividends Paid Total Cash Preferred Dividends Total Cash Common Dividends Trailing 12M Prefered Dividends Trailing 12M Common Dividends Trailing 12M Dividends Per Share FY 2017 06/30/2010 06/30/2011 06/30/2012 06/30/2013 06/30/2014 06/30/2015 06/30/2016 06/30/2017 1.39 4.4141 3.577 60.8399 1.6437 -138.3 0.0 140.4 FY 2013 1.52 76.0031 3.2846 73.879 1.3536 146.8 0.0 152.9 0.0 152.9 1.52 1.52 16.7748 4.4562 59.7343 1.6741 153.1 0.0 153.3 0.0 153.3 1.52 0.84 1.12 1.37 1.52 12.5934 4.9715 62.7218 1.5943 158.4 0.0 153.4 0.0 153.4 1.52 1.5634 49.9374 2.0025 25.9 0.0 69.8 4.7015 56.008 1.7855 89.0 0.0 112.1 3.7003 60.0536 1.6652 79.9 2.9748 55.9101 1.7886 0.0 137.6 0.0 137.6 1.37 84.0 0.0 84.0 0.84 140.4 1.39 69.8 0.7 112.1 1.12


