any help would be great! step by step
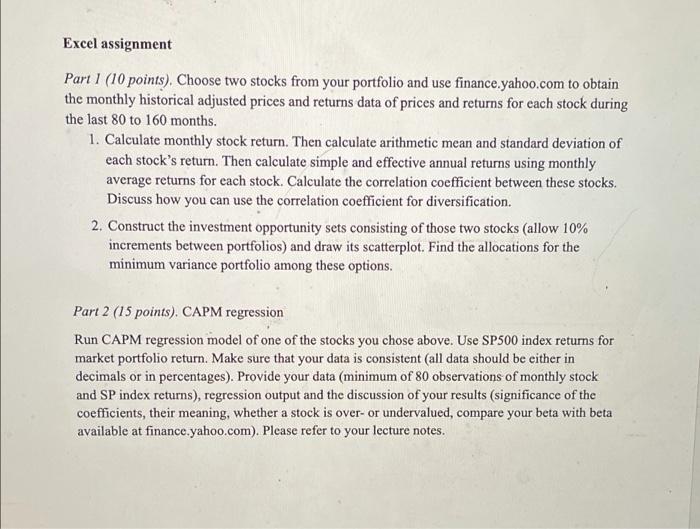
Excel assignment Part 1 (10 points). Choose two stocks from your portfolio and use finance.yahoo.com to obtain the monthly historical adjusted prices and returns data of prices and returns for each stock during the last 80 to 160 months. 1. Calculate monthly stock return. Then calculate arithmetic mean and standard deviation of each stock's return. Then calculate simple and effective annual returns using monthly average returns for each stock. Calculate the correlation coefficient between these stocks. Discuss how you can use the correlation coefficient for diversification. 2. Construct the investment opportunity sets consisting of those two stocks (allow 10% increments between portfolios) and draw its scatterplot. Find the allocations for the minimum variance portfolio among these options. Part 2 (15 points). CAPM regression Run CAPM regression model of one of the stocks you chose above. Use SP500 index returns for market portfolio return. Make sure that your data is consistent (all data should be either in decimals or in percentages). Provide your data (minimum of 80 observations of monthly stock and SP index returns), regression output and the discussion of your results (significance of the coefficients, their meaning, whether a stock is over- or undervalued, compare your beta with beta available at finance.yahoo.com). Please refer to your lecture notes. Excel assignment Part 1 (10 points). Choose two stocks from your portfolio and use finance.yahoo.com to obtain the monthly historical adjusted prices and returns data of prices and returns for each stock during the last 80 to 160 months. 1. Calculate monthly stock return. Then calculate arithmetic mean and standard deviation of each stock's return. Then calculate simple and effective annual returns using monthly average returns for each stock. Calculate the correlation coefficient between these stocks. Discuss how you can use the correlation coefficient for diversification. 2. Construct the investment opportunity sets consisting of those two stocks (allow 10% increments between portfolios) and draw its scatterplot. Find the allocations for the minimum variance portfolio among these options. Part 2 (15 points). CAPM regression Run CAPM regression model of one of the stocks you chose above. Use SP500 index returns for market portfolio return. Make sure that your data is consistent (all data should be either in decimals or in percentages). Provide your data (minimum of 80 observations of monthly stock and SP index returns), regression output and the discussion of your results (significance of the coefficients, their meaning, whether a stock is over- or undervalued, compare your beta with beta available at finance.yahoo.com). Please refer to your lecture notes


