

Question
Any idea on how to get these ratios? Assignment 3: Calculating Liquidity Ratios from Financial Statements. Using General Fund data in Chen, Tables 26.2 (page
Any idea on how to get these ratios?
Assignment 3: Calculating Liquidity Ratios from Financial Statements. Using General Fund data in Chen, Tables 26.2 (page 255) and 26.3 (page 256) for the year 2013, prepare a spreadsheet that shows Charlottesvilles current ratio, working capital, quick ratio, debt to asset ratio, and profit margin ratio for that year. In a Word document, comment on what these results mean in terms of the financial health of Charlottesville.
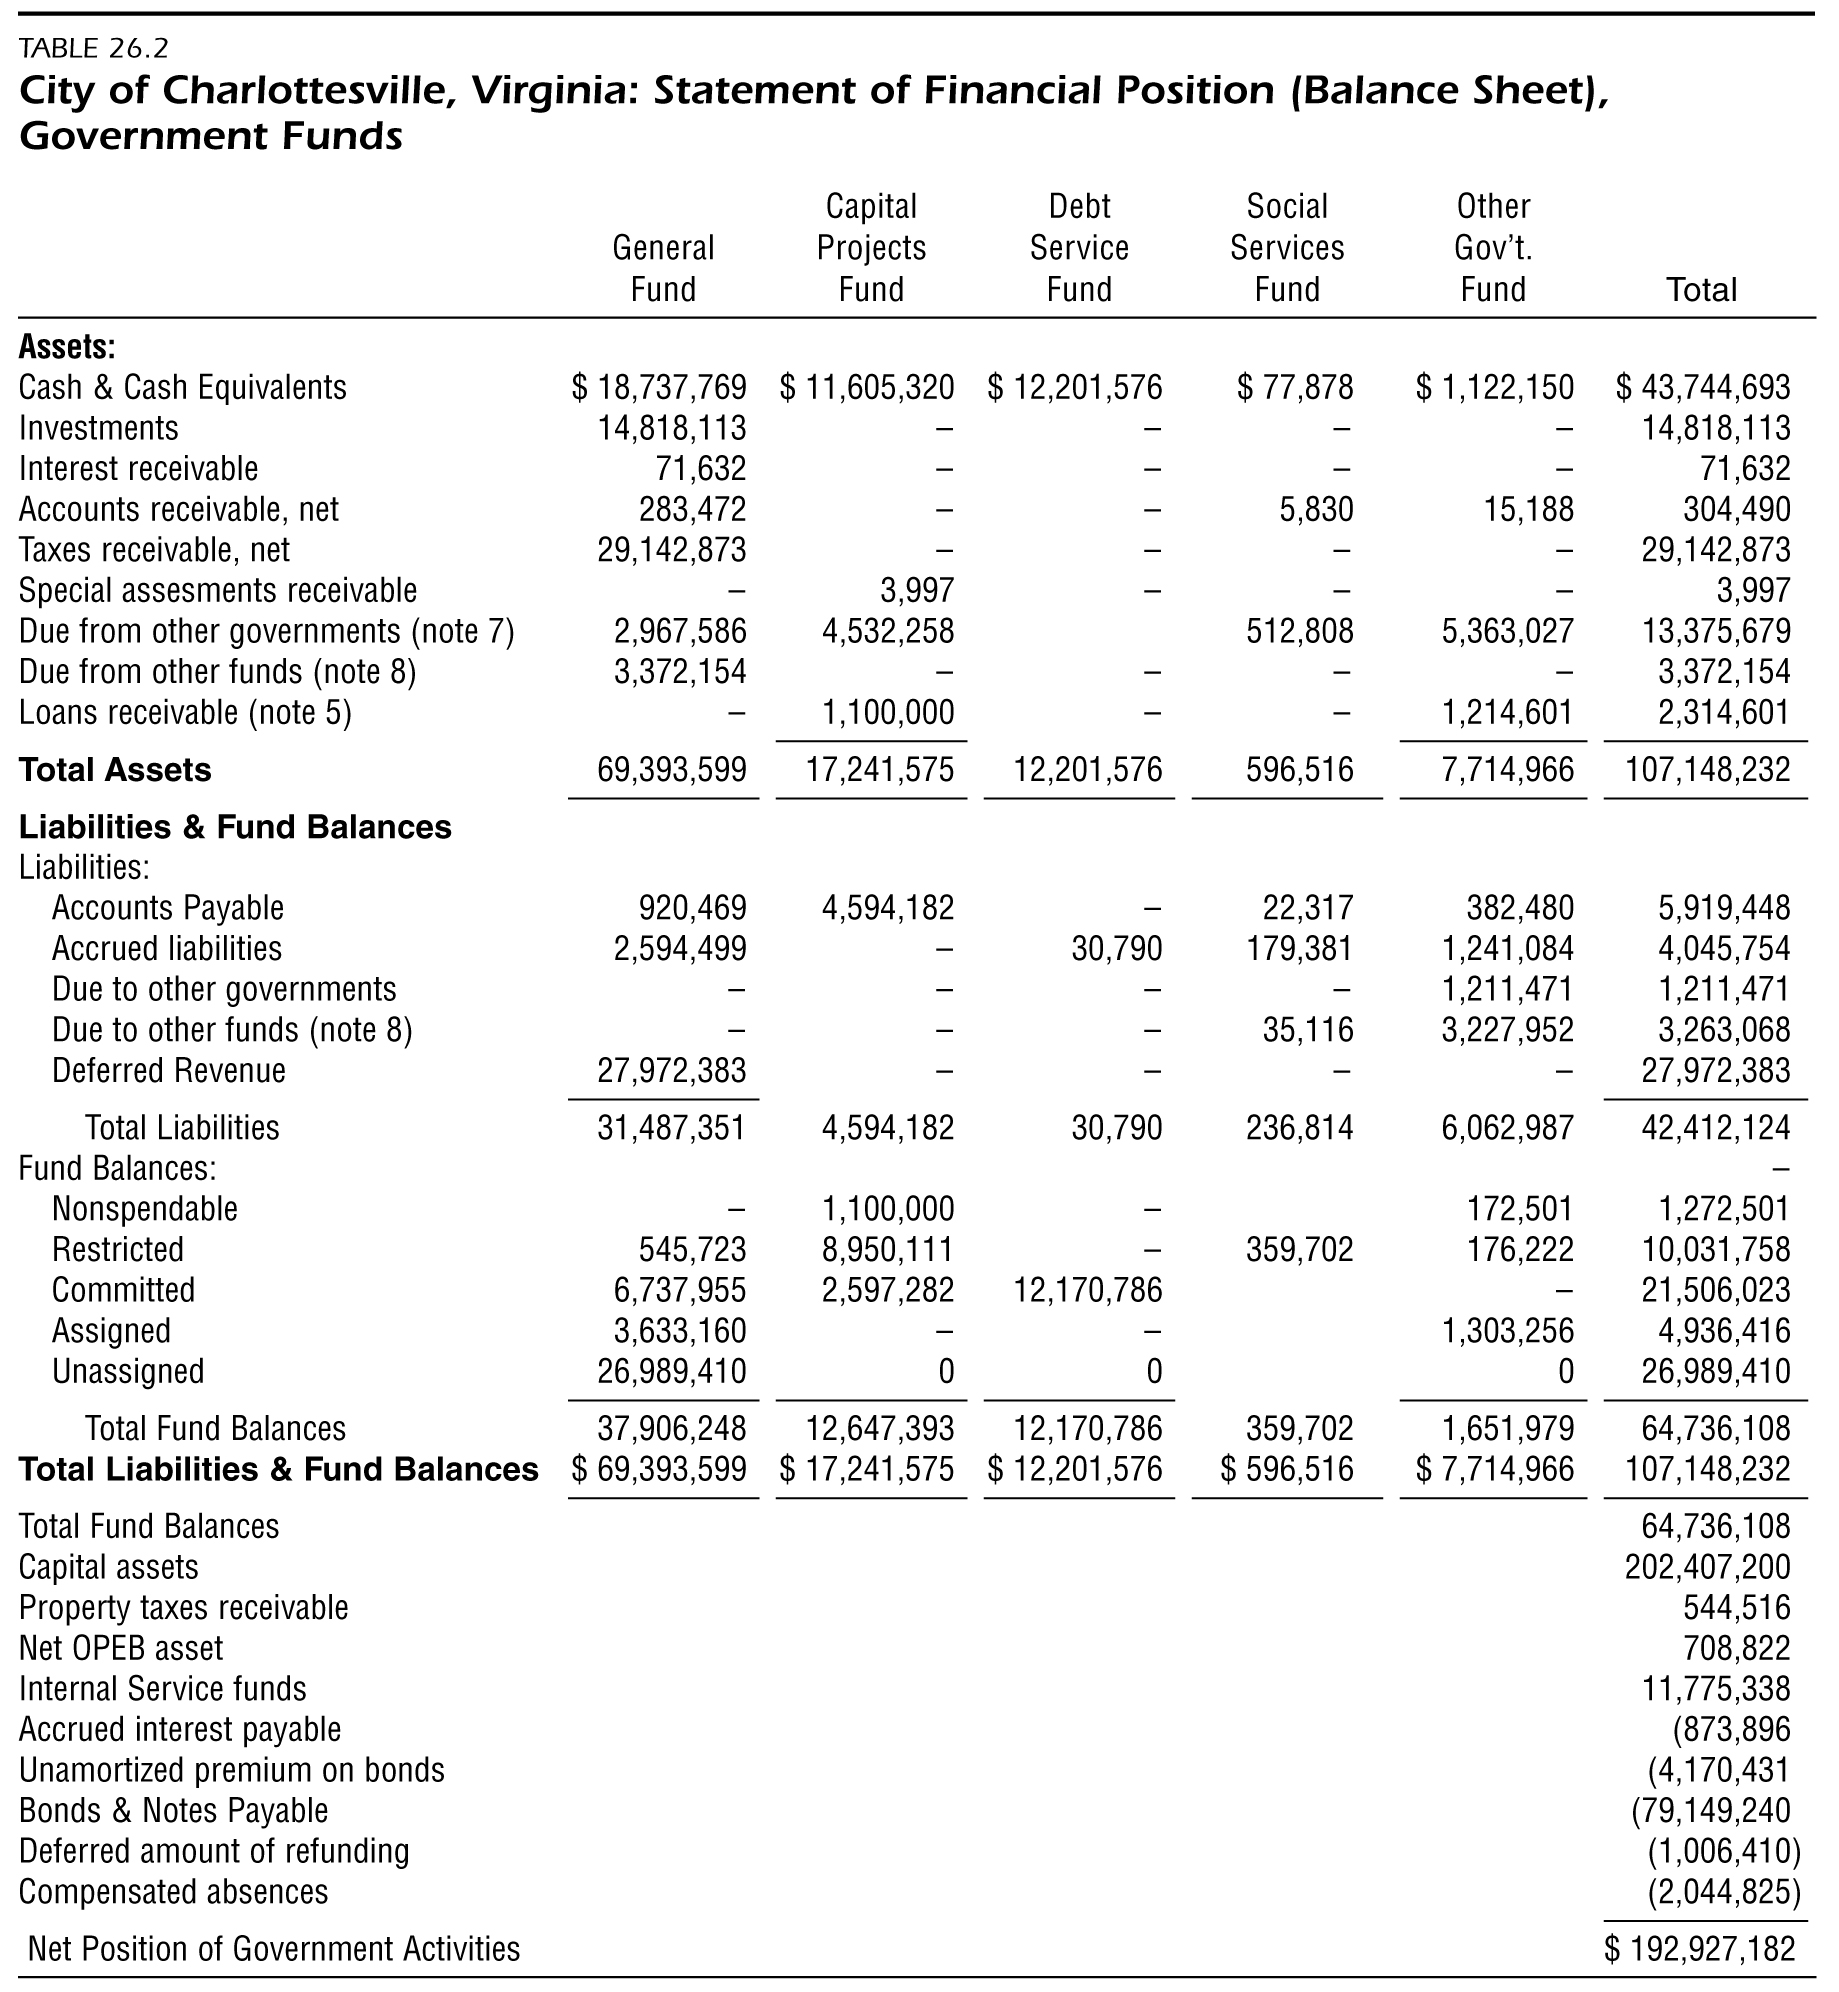
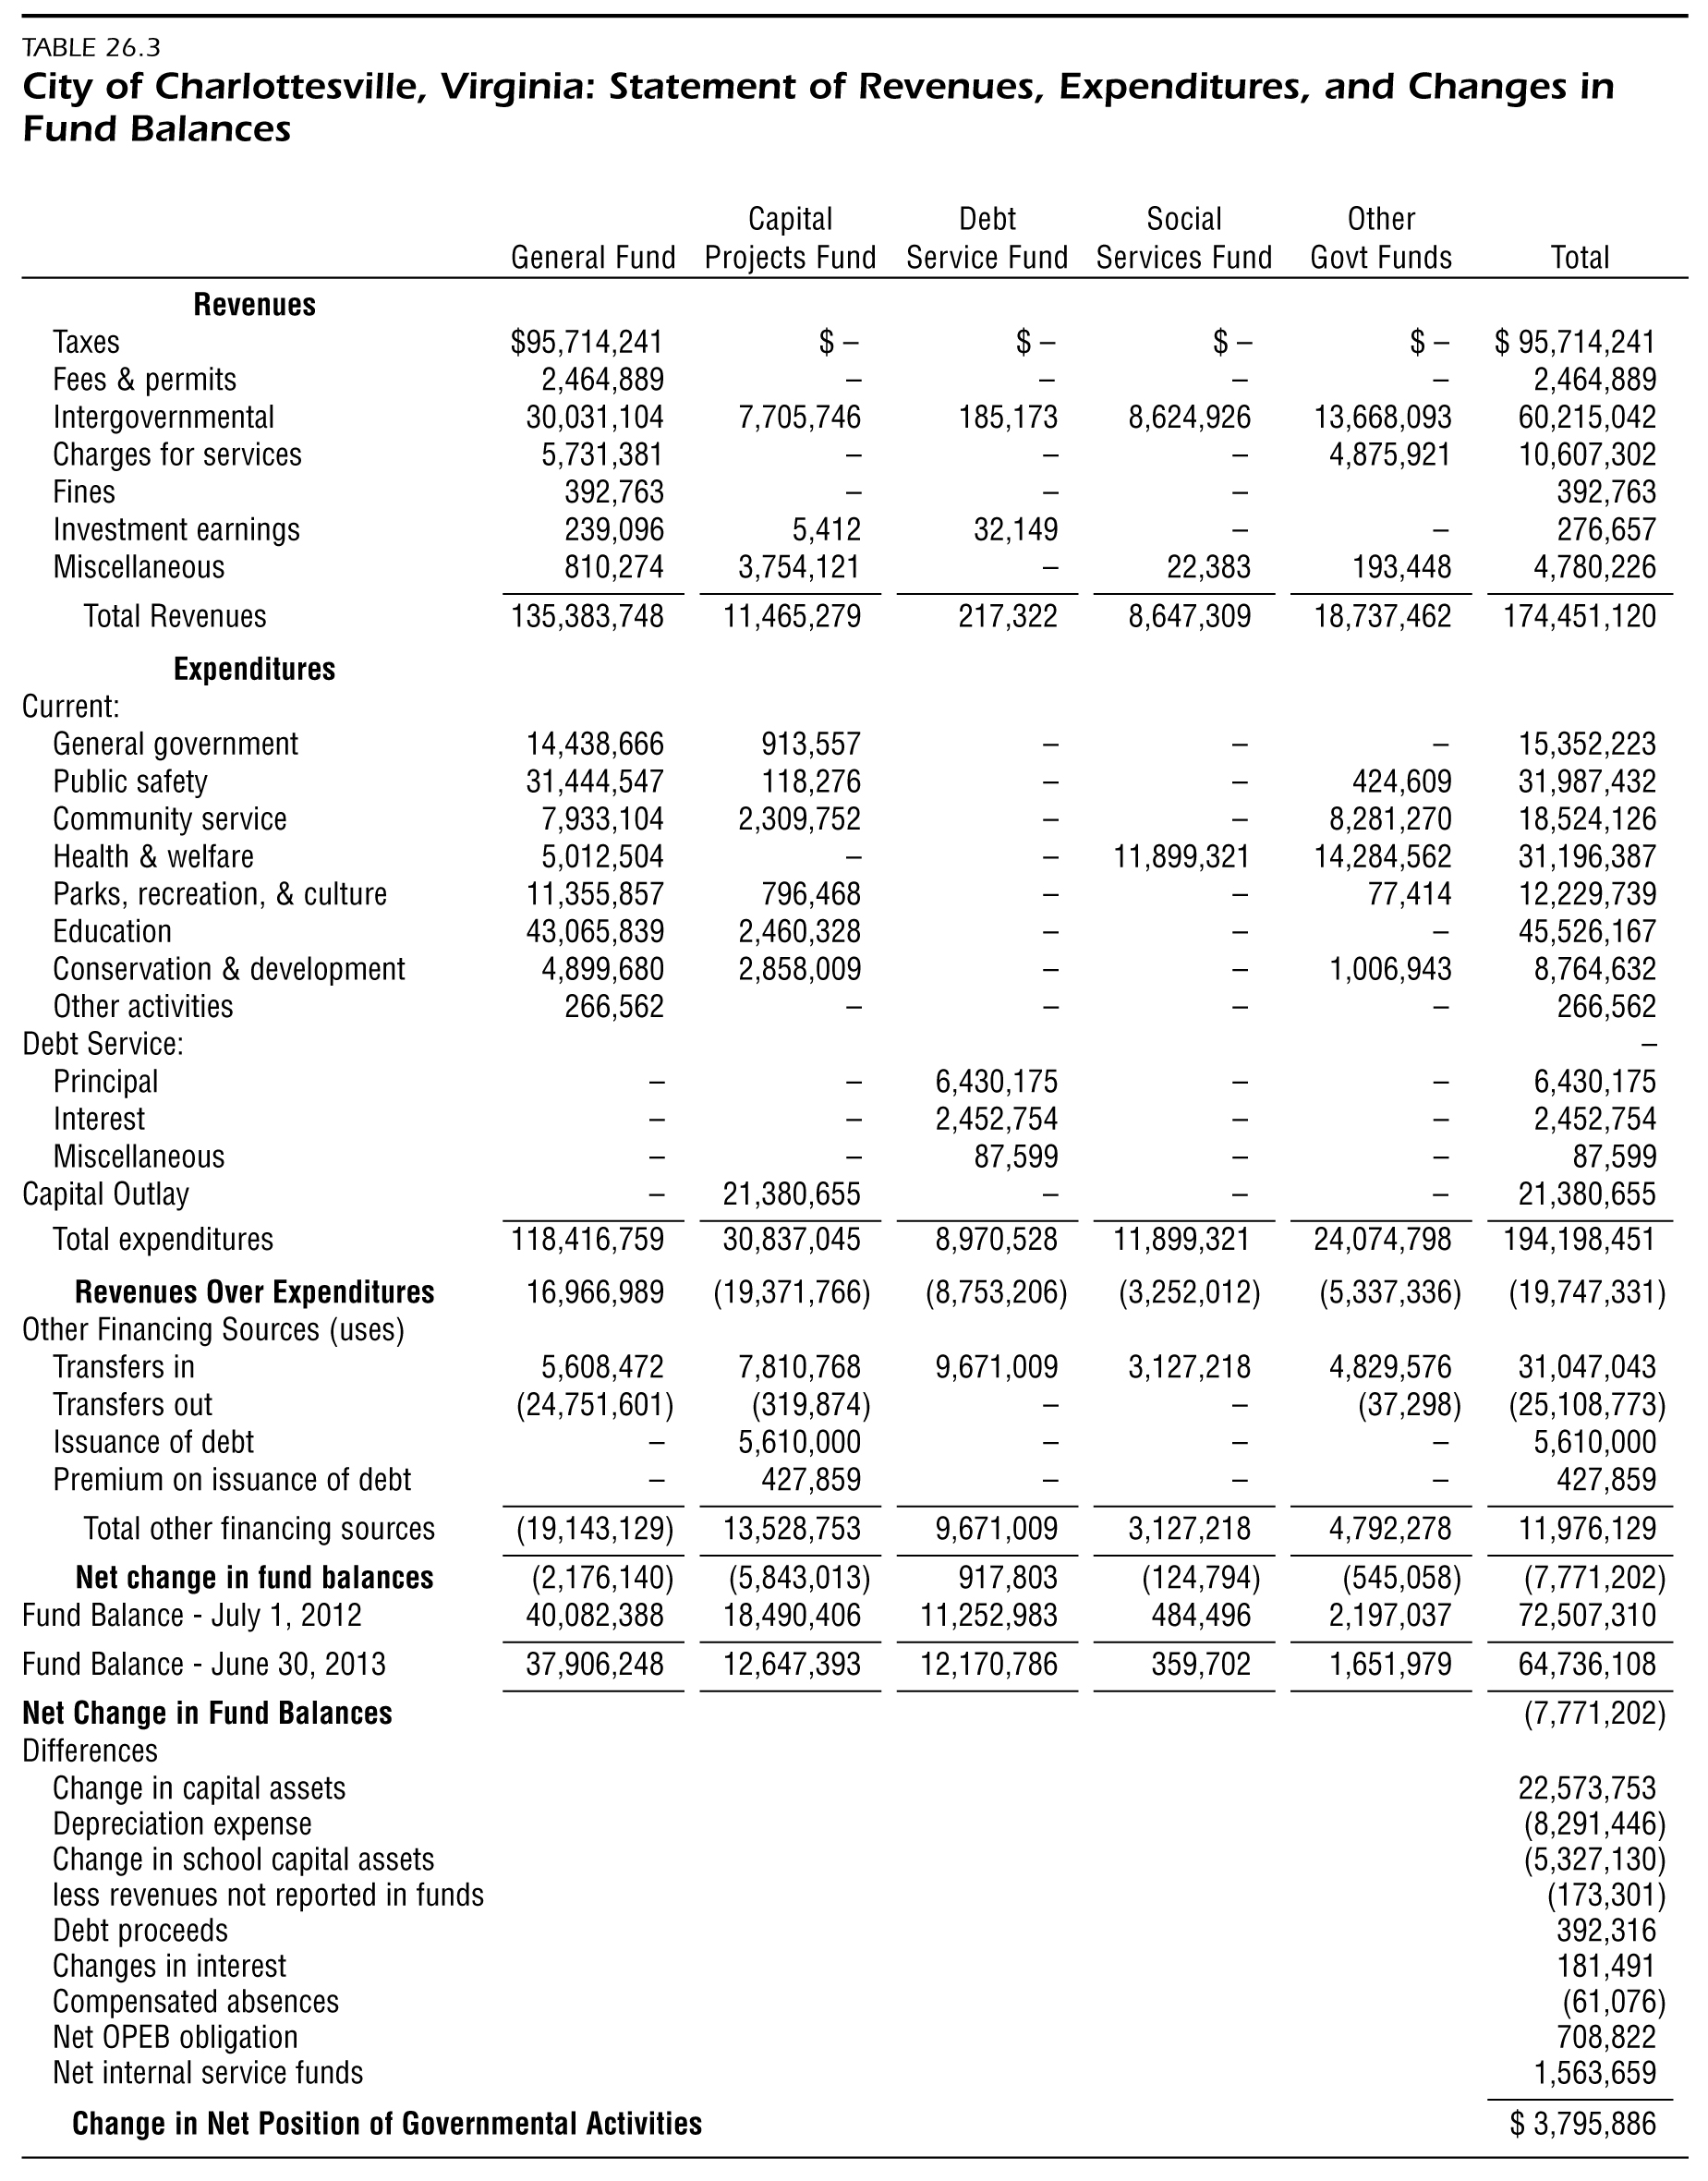 TABLE 26.2 TABLE 26.3 City of Charlottesville, Virginia: Statement of Revenues, Expenditures, and Changes in Fund Balances \begin{tabular}{|c|c|c|c|c|c|c|} \hline & General Fund & \begin{tabular}{c} Capital \\ Projects Fund \end{tabular} & \begin{tabular}{c} Debt \\ Service Fund \\ \end{tabular} & \begin{tabular}{c} Social \\ Services Fund \end{tabular} & \begin{tabular}{c} Other \\ Govt Funds \end{tabular} & Total \\ \hline \multicolumn{7}{|l|}{ Revenues } \\ \hline Taxes & $95,714,241 & $ & $ & $ & $ & $95,714,241 \\ \hline Fees \& permits & 2,464,889 & - & - & - & - & 2,464,889 \\ \hline Intergovernmental & 30,031,104 & 7,705,746 & 185,173 & 8,624,926 & 13,668,093 & 60,215,042 \\ \hline Charges for services & 5,731,381 & - & - & \begin{tabular}{llll} - \\ - \end{tabular} & 4,875,921 & 10,607,302 \\ \hline Fines & 392,763 & - & - & - & & 392,763 \\ \hline Investment earnings & 239,096 & 5,412 & 32,149 & - & - & 276,657 \\ \hline Miscellaneous & 810,274 & 3,754,121 & - & 22,383 & 193,448 & 4,780,226 \\ \hline Total Revenues & 135,383,748 & 11,465,279 & 217,322 & 8,647,309 & 18,737,462 & 174,451,120 \\ \hline \multicolumn{7}{|l|}{ Expenditures } \\ \hline \multicolumn{7}{|l|}{ Current: } \\ \hline General government & 14,438,666 & 913,557 & - & - & - & 15,352,223 \\ \hline Public safety & 31,444,547 & 118,276 & - & - & 424,609 & 31,987,432 \\ \hline Community service & 7,933,104 & 2,309,752 & - & - & 8,281,270 & 18,524,126 \\ \hline Health \& welfare & 5,012,504 & - & - & 11,899,321 & 14,284,562 & 31,196,387 \\ \hline Parks, recreation, \& culture & 11,355,857 & 796,468 & - & - & 77,414 & 12,229,739 \\ \hline Education & 43,065,839 & 2,460,328 & - & - & - & 45,526,167 \\ \hline Conservation \& development & 4,899,680 & 2,858,009 & - & - & 1,006,943 & 8,764,632 \\ \hline Other activities & 266,562 & & - & - & & 266,562 \\ \hline \multicolumn{7}{|l|}{ Debt Service: } \\ \hline Principal & - & - & 6,430,175 & - & - & 6,430,175 \\ \hline Interest & - & - & 2,452,754 & - & - & 2,452,754 \\ \hline Miscellaneous & - & - & 87,599 & - & - & 87,599 \\ \hline Capital Outlay & - & 21,380,655 & - & - & - & 21,380,655 \\ \hline Total expenditures & 118,416,759 & 30,837,045 & 8,970,528 & 11,899,321 & 24,074,798 & 194,198,451 \\ \hline Revenues Over Expenditures & 16,966,989 & (19,371,766) & (8,753,206) & (3,252,012) & (5,337,336) & (19,747,331) \\ \hline \multicolumn{7}{|l|}{ Other Financing Sources (uses) } \\ \hline Transfers in & 5,608,472 & 7,810,768 & 9,671,009 & 3,127,218 & 4,829,576 & 31,047,043 \\ \hline Transfers out & (24,751,601) & (319,874) & - & - & (37,298) & (25,108,773) \\ \hline Issuance of debt & - & 5,610,000 & - & - & - & 5,610,000 \\ \hline Premium on issuance of debt & - & 427,859 & - & - & - & 427,859 \\ \hline Total other financing sources & (19,143,129) & 13,528,753 & 9,671,009 & 3,127,218 & 4,792,278 & 11,976,129 \\ \hline Net change in fund balances & (2,176,140) & (5,843,013) & 917,803 & (124,794) & (545,058) & (7,771,202) \\ \hline Fund Balance - July 1, 2012 & 40,082,388 & 18,490,406 & 11,252,983 & 484,496 & 2,197,037 & 72,507,310 \\ \hline Fund Balance - June 30, 2013 & 37,906,248 & 12,647,393 & 12,170,786 & 359,702 & 1,651,979 & 64,736,108 \\ \hline \multirow{2}{*}{\multicolumn{7}{|c|}{\begin{tabular}{l} Net Change i \\ Differences \end{tabular}}} \\ \hline & & & & & & \\ \hline Change in capital assets & & & & & & 22,573,753 \\ \hline Depreciation expense & & & & & & (8,291,446) \\ \hline Change in school capital assets & & & & & & (5,327,130) \\ \hline less revenues not reported in funds & & & & & & (173,301) \\ \hline Debt proceeds & & & & & & 392,316 \\ \hline Changes in interest & & & & & & 181,491 \\ \hline Compensated absences & & & & & & (61,076) \\ \hline Net OPEB obligation & & & & & & 708,822 \\ \hline Net internal service funds & & & & & & 1,563,659 \\ \hline Change in Net Position of Governn & mental Activities & & & & & $3,795,886 \\ \hline \end{tabular} TABLE 26.2 TABLE 26.3 City of Charlottesville, Virginia: Statement of Revenues, Expenditures, and Changes in Fund Balances \begin{tabular}{|c|c|c|c|c|c|c|} \hline & General Fund & \begin{tabular}{c} Capital \\ Projects Fund \end{tabular} & \begin{tabular}{c} Debt \\ Service Fund \\ \end{tabular} & \begin{tabular}{c} Social \\ Services Fund \end{tabular} & \begin{tabular}{c} Other \\ Govt Funds \end{tabular} & Total \\ \hline \multicolumn{7}{|l|}{ Revenues } \\ \hline Taxes & $95,714,241 & $ & $ & $ & $ & $95,714,241 \\ \hline Fees \& permits & 2,464,889 & - & - & - & - & 2,464,889 \\ \hline Intergovernmental & 30,031,104 & 7,705,746 & 185,173 & 8,624,926 & 13,668,093 & 60,215,042 \\ \hline Charges for services & 5,731,381 & - & - & \begin{tabular}{llll} - \\ - \end{tabular} & 4,875,921 & 10,607,302 \\ \hline Fines & 392,763 & - & - & - & & 392,763 \\ \hline Investment earnings & 239,096 & 5,412 & 32,149 & - & - & 276,657 \\ \hline Miscellaneous & 810,274 & 3,754,121 & - & 22,383 & 193,448 & 4,780,226 \\ \hline Total Revenues & 135,383,748 & 11,465,279 & 217,322 & 8,647,309 & 18,737,462 & 174,451,120 \\ \hline \multicolumn{7}{|l|}{ Expenditures } \\ \hline \multicolumn{7}{|l|}{ Current: } \\ \hline General government & 14,438,666 & 913,557 & - & - & - & 15,352,223 \\ \hline Public safety & 31,444,547 & 118,276 & - & - & 424,609 & 31,987,432 \\ \hline Community service & 7,933,104 & 2,309,752 & - & - & 8,281,270 & 18,524,126 \\ \hline Health \& welfare & 5,012,504 & - & - & 11,899,321 & 14,284,562 & 31,196,387 \\ \hline Parks, recreation, \& culture & 11,355,857 & 796,468 & - & - & 77,414 & 12,229,739 \\ \hline Education & 43,065,839 & 2,460,328 & - & - & - & 45,526,167 \\ \hline Conservation \& development & 4,899,680 & 2,858,009 & - & - & 1,006,943 & 8,764,632 \\ \hline Other activities & 266,562 & & - & - & & 266,562 \\ \hline \multicolumn{7}{|l|}{ Debt Service: } \\ \hline Principal & - & - & 6,430,175 & - & - & 6,430,175 \\ \hline Interest & - & - & 2,452,754 & - & - & 2,452,754 \\ \hline Miscellaneous & - & - & 87,599 & - & - & 87,599 \\ \hline Capital Outlay & - & 21,380,655 & - & - & - & 21,380,655 \\ \hline Total expenditures & 118,416,759 & 30,837,045 & 8,970,528 & 11,899,321 & 24,074,798 & 194,198,451 \\ \hline Revenues Over Expenditures & 16,966,989 & (19,371,766) & (8,753,206) & (3,252,012) & (5,337,336) & (19,747,331) \\ \hline \multicolumn{7}{|l|}{ Other Financing Sources (uses) } \\ \hline Transfers in & 5,608,472 & 7,810,768 & 9,671,009 & 3,127,218 & 4,829,576 & 31,047,043 \\ \hline Transfers out & (24,751,601) & (319,874) & - & - & (37,298) & (25,108,773) \\ \hline Issuance of debt & - & 5,610,000 & - & - & - & 5,610,000 \\ \hline Premium on issuance of debt & - & 427,859 & - & - & - & 427,859 \\ \hline Total other financing sources & (19,143,129) & 13,528,753 & 9,671,009 & 3,127,218 & 4,792,278 & 11,976,129 \\ \hline Net change in fund balances & (2,176,140) & (5,843,013) & 917,803 & (124,794) & (545,058) & (7,771,202) \\ \hline Fund Balance - July 1, 2012 & 40,082,388 & 18,490,406 & 11,252,983 & 484,496 & 2,197,037 & 72,507,310 \\ \hline Fund Balance - June 30, 2013 & 37,906,248 & 12,647,393 & 12,170,786 & 359,702 & 1,651,979 & 64,736,108 \\ \hline \multirow{2}{*}{\multicolumn{7}{|c|}{\begin{tabular}{l} Net Change i \\ Differences \end{tabular}}} \\ \hline & & & & & & \\ \hline Change in capital assets & & & & & & 22,573,753 \\ \hline Depreciation expense & & & & & & (8,291,446) \\ \hline Change in school capital assets & & & & & & (5,327,130) \\ \hline less revenues not reported in funds & & & & & & (173,301) \\ \hline Debt proceeds & & & & & & 392,316 \\ \hline Changes in interest & & & & & & 181,491 \\ \hline Compensated absences & & & & & & (61,076) \\ \hline Net OPEB obligation & & & & & & 708,822 \\ \hline Net internal service funds & & & & & & 1,563,659 \\ \hline Change in Net Position of Governn & mental Activities & & & & & $3,795,886 \\ \hline \end{tabular}
 Step by Step Solution
There are 3 Steps involved in it
Step: 1

Get Instant Access to Expert-Tailored Solutions
See step-by-step solutions with expert insights and AI powered tools for academic success
Step: 2

Step: 3
Ace Your Homework with AI
Get the answers you need in no time with our AI-driven, step-by-step assistance
Get Started
The Handbook Of Sentiment Analysis In Finance
Authors: Gautam Mitra, Xiang Yu
1st Edition
1910571571, 978-1910571576