Answered step by step
Verified Expert Solution
Question
1 Approved Answer
anyone have any insight on this assignment? Homework Assignment 2 In this exercise, you will use database software to analyze the reservation transactions for a
anyone have any insight on this assignment? 


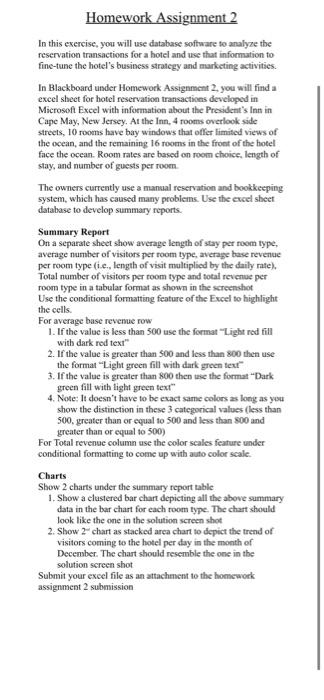
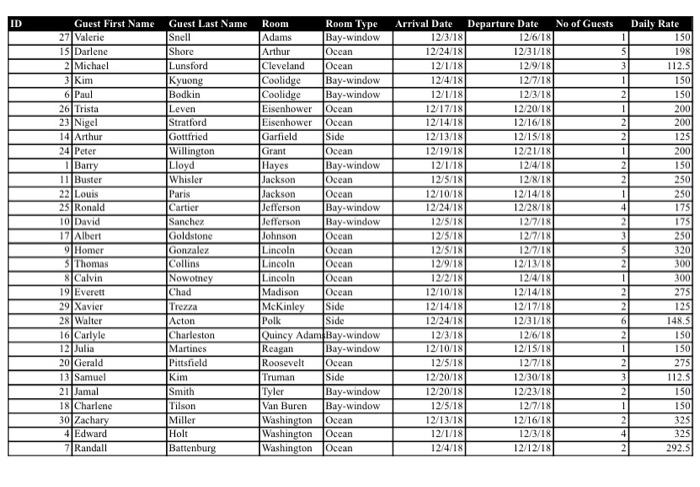
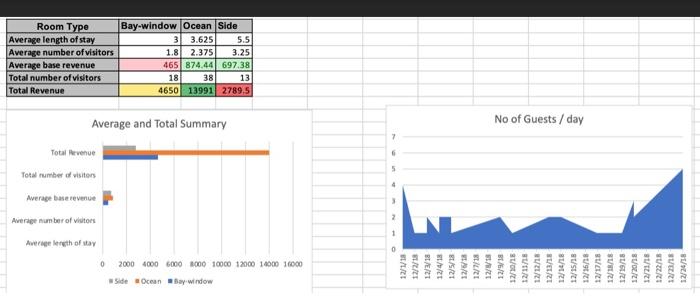
Homework Assignment 2 In this exercise, you will use database software to analyze the reservation transactions for a hotel and use that information to fine-tune the hotel's business strategy and marketing activities. In Blackboard under Homework Assignment 2 you will find a excel sheet for hotel reservation transactions developed in Microsoft Excel with information about the President's Inn in Cape May, New Jersey. At the Inn, 4 rooms overlook side streets, 10 rooms have bay windows that offer limited views of the ocean, and the remaining 16 rooms in the front of the hotel face the ocean. Room rates are based on room choice, length of stay, and number of guests per room. The owners currently use a manual reservation and bookkeeping system, which has caused many problems. Use the excel sheet database to develop summary reports. Summary Report On a separate sheet show average length of stay per room type, average number of visitors per room type, average base revenue per room type (i.c., length of visit multiplied by the daily rate). Total number of visitors per room type and total revenue per room type in a tabular format as shown in the screenshot Use the conditional formatting feature of the Excel to highlight the cells. For average base revenue row 1. If the value is less than 500 use the format "Light red fill with dark red text" 2. If the value is greater than 500 and less than 800 then use the format "Light green fill with dark green text 3. If the value is greater than 800 then use the format "Dark green fill with light green text 4. Note: It doesn't have to be exact same colors as long as you show the distinction in these 3 categorical values (less than 500 greater than or equal to 500 and less than 800 and greater than or equal to 500) For Total revenue column use the color scales feature under conditional formatting to come up with auto color scale. Charts Show 2 charts under the summary report table 1. Show a clustered bar chart depicting all the above summary data in the bar chart for each room type. The chart should look like the one in the solution screen shot 2. Show 2-chart as stacked area chart to depict the trend of Visitors coming to the hotel per day in the month of December. The chart should resemble the one in the solution screen shot Submit your excel file as an attachment to the homework assignment 2 submission ID 3 1 2 1 2 Guest First Name 27 Valerie 15 Darlene 2 Michael 3]Kimi 6 Paul 26 Trista 23 Nigel 14 Arthur 24 Peter 1 Barry 11 Buster 22 Louis 25 Ronald 10 David 171 Albert Homer Thomas Calvin 19 Everett 29 Xavier 2x Walter 16 Carlyle 12 Julia 20 Gerald 13 Samuel 21 Jamal 18 Charlene 30 Zachary 4 Edward 7 Randall 2 Guest Last Name Snell Shore Lunsford Kyuong Bodkin Leven Stratford Gottfried Willington Lloyd Whisler Paris Cartier Sanchez Goldstone Gonzalez Collins Nowotney Chad Trezza Acton Charleston Martines Pittsfield Kim Smith Tilson Miller Holt Battenburg Room Room Type Adams Bay-window Arthur Occan Cleveland Ocean Coolidge Bay-window Coolidge Bay-window Eisenhower Ocean Eisenhower Ocean Garfield Side Grant Ocean Hayes Bay-window Jackson Ocean Jackson Ocean Jefferson Bay-window Jefferson Bay-window Johnson Ocean Lincoln Ocean Lincoln Ocean Lincoln Ocean Madison Ocean McKinley Side Polk Side Quincy Adam Bay-window Reagan Bay-window Roosevelt Ocean Truman Side Tyler Bay-window Van Buren Bay-window Washington Ocean Washington Ocean Washington Ocean Arrival Date Departure Date No of Guests 12/3/18 12/6/18 12/24/18 12/31/18 12/1/18 12/9/18 12/4/18 12.7/18 12/1/18 12/3/18 12/17/18 12/20/18 12/14/18 12/16/181 12/13/18 12/15/181 12/19/18 12/21/18 12/1/18 12/4/18 12/5/18 12/8/18 12/10/18 12/14/18 12/24/18 12/28/18 12/5/18 12/7/18 12/5/18 12/7/18 12/5/18 12/7/18 12/9/181 12/13/18 12/2/18 12/4/18 12/10/18 12/14/18 12/14/18 12/17/18 12/24/18 12/31/18 12/3/18 12/6/18 12/10/18 12/15/18 12/5/18 12/7/18 12/20/18 12/30/18 12/20/18 12/23/18 12/5/18 12/7/18 12/13/18 12/16/18 12/1/18 12/3/18 12/4/18 12/12/18 Daily Rate 150 198 112.5 150 150 2001 200 125 200 150 250 250 175 175 250 320 300 300 2 6 275 125 148.5 ISO 150 275 112.5 150 150 325 325 292.5 3 2 1 2 4 Room Type Average length of stay Average number of visitors Average base revenue Total number of visitors Total Revenue Bay-window Ocean Side 3 3.625 5.5 1.8 2.375 3.25 465 874.441 697.38 18 38 13 4650 13991 2789.5 Average and Total Summary No of Guests / day Total revenue 6 5 Total number of visitors Average base revenue Average number of vitori Average oth of stay 0 | | BU 0 2000 4000 6000 1000 10000 12000 16000 16000 t/ t/ 12/1/18 // IEET 12/18 SACT 12/18 12/7/18 17/18 12/9/18 12/10/15 12/12/13 12/14/18 12/15/18 12/16/18 12/8/18 12/19/18 // 12/21/18 2/22/18 SURE 12/26/18 Side Ocean Bay window Homework Assignment 2 In this exercise, you will use database software to analyze the reservation transactions for a hotel and use that information to fine-tune the hotel's business strategy and marketing activities. In Blackboard under Homework Assignment 2 you will find a excel sheet for hotel reservation transactions developed in Microsoft Excel with information about the President's Inn in Cape May, New Jersey. At the Inn, 4 rooms overlook side streets, 10 rooms have bay windows that offer limited views of the ocean, and the remaining 16 rooms in the front of the hotel face the ocean. Room rates are based on room choice, length of stay, and number of guests per room. The owners currently use a manual reservation and bookkeeping system, which has caused many problems. Use the excel sheet database to develop summary reports. Summary Report On a separate sheet show average length of stay per room type, average number of visitors per room type, average base revenue per room type (i.c., length of visit multiplied by the daily rate). Total number of visitors per room type and total revenue per room type in a tabular format as shown in the screenshot Use the conditional formatting feature of the Excel to highlight the cells. For average base revenue row 1. If the value is less than 500 use the format "Light red fill with dark red text" 2. If the value is greater than 500 and less than 800 then use the format "Light green fill with dark green text 3. If the value is greater than 800 then use the format "Dark green fill with light green text 4. Note: It doesn't have to be exact same colors as long as you show the distinction in these 3 categorical values (less than 500 greater than or equal to 500 and less than 800 and greater than or equal to 500) For Total revenue column use the color scales feature under conditional formatting to come up with auto color scale. Charts Show 2 charts under the summary report table 1. Show a clustered bar chart depicting all the above summary data in the bar chart for each room type. The chart should look like the one in the solution screen shot 2. Show 2-chart as stacked area chart to depict the trend of Visitors coming to the hotel per day in the month of December. The chart should resemble the one in the solution screen shot Submit your excel file as an attachment to the homework assignment 2 submission ID 3 1 2 1 2 Guest First Name 27 Valerie 15 Darlene 2 Michael 3]Kimi 6 Paul 26 Trista 23 Nigel 14 Arthur 24 Peter 1 Barry 11 Buster 22 Louis 25 Ronald 10 David 171 Albert Homer Thomas Calvin 19 Everett 29 Xavier 2x Walter 16 Carlyle 12 Julia 20 Gerald 13 Samuel 21 Jamal 18 Charlene 30 Zachary 4 Edward 7 Randall 2 Guest Last Name Snell Shore Lunsford Kyuong Bodkin Leven Stratford Gottfried Willington Lloyd Whisler Paris Cartier Sanchez Goldstone Gonzalez Collins Nowotney Chad Trezza Acton Charleston Martines Pittsfield Kim Smith Tilson Miller Holt Battenburg Room Room Type Adams Bay-window Arthur Occan Cleveland Ocean Coolidge Bay-window Coolidge Bay-window Eisenhower Ocean Eisenhower Ocean Garfield Side Grant Ocean Hayes Bay-window Jackson Ocean Jackson Ocean Jefferson Bay-window Jefferson Bay-window Johnson Ocean Lincoln Ocean Lincoln Ocean Lincoln Ocean Madison Ocean McKinley Side Polk Side Quincy Adam Bay-window Reagan Bay-window Roosevelt Ocean Truman Side Tyler Bay-window Van Buren Bay-window Washington Ocean Washington Ocean Washington Ocean Arrival Date Departure Date No of Guests 12/3/18 12/6/18 12/24/18 12/31/18 12/1/18 12/9/18 12/4/18 12.7/18 12/1/18 12/3/18 12/17/18 12/20/18 12/14/18 12/16/181 12/13/18 12/15/181 12/19/18 12/21/18 12/1/18 12/4/18 12/5/18 12/8/18 12/10/18 12/14/18 12/24/18 12/28/18 12/5/18 12/7/18 12/5/18 12/7/18 12/5/18 12/7/18 12/9/181 12/13/18 12/2/18 12/4/18 12/10/18 12/14/18 12/14/18 12/17/18 12/24/18 12/31/18 12/3/18 12/6/18 12/10/18 12/15/18 12/5/18 12/7/18 12/20/18 12/30/18 12/20/18 12/23/18 12/5/18 12/7/18 12/13/18 12/16/18 12/1/18 12/3/18 12/4/18 12/12/18 Daily Rate 150 198 112.5 150 150 2001 200 125 200 150 250 250 175 175 250 320 300 300 2 6 275 125 148.5 ISO 150 275 112.5 150 150 325 325 292.5 3 2 1 2 4 Room Type Average length of stay Average number of visitors Average base revenue Total number of visitors Total Revenue Bay-window Ocean Side 3 3.625 5.5 1.8 2.375 3.25 465 874.441 697.38 18 38 13 4650 13991 2789.5 Average and Total Summary No of Guests / day Total revenue 6 5 Total number of visitors Average base revenue Average number of vitori Average oth of stay 0 | | BU 0 2000 4000 6000 1000 10000 12000 16000 16000 t/ t/ 12/1/18 // IEET 12/18 SACT 12/18 12/7/18 17/18 12/9/18 12/10/15 12/12/13 12/14/18 12/15/18 12/16/18 12/8/18 12/19/18 // 12/21/18 2/22/18 SURE 12/26/18 Side Ocean Bay window 


Step by Step Solution
There are 3 Steps involved in it
Step: 1

Get Instant Access to Expert-Tailored Solutions
See step-by-step solutions with expert insights and AI powered tools for academic success
Step: 2

Step: 3

Ace Your Homework with AI
Get the answers you need in no time with our AI-driven, step-by-step assistance
Get Started


