Anyone help me solve this From 2008 until 2019, the average GDP growth rate has been approximately 2.5% and inflation has been approximately 2.1%.a) Explain with reference to the forecast data in these tables why you think that the RBA saw a case to adjust the target cash rate at its March meeting, but kept the cash rate constant at its February and May meetings. [4 marks]b) Suppose that new data comes in after May 2020 that is very different to the forecasts. Suggest one possible change in the data that might cause the RBA to want to adjust the target cash rate, and explain how and why they would make this change. [3 marks]c) Imagine that the RBA was not an independent central bank, that is, suppose the Governor was subject to active political pressure by the incumbent government. Describe the likely scenario the Governor would face in the lead-up to an election and explain why. [3 marks
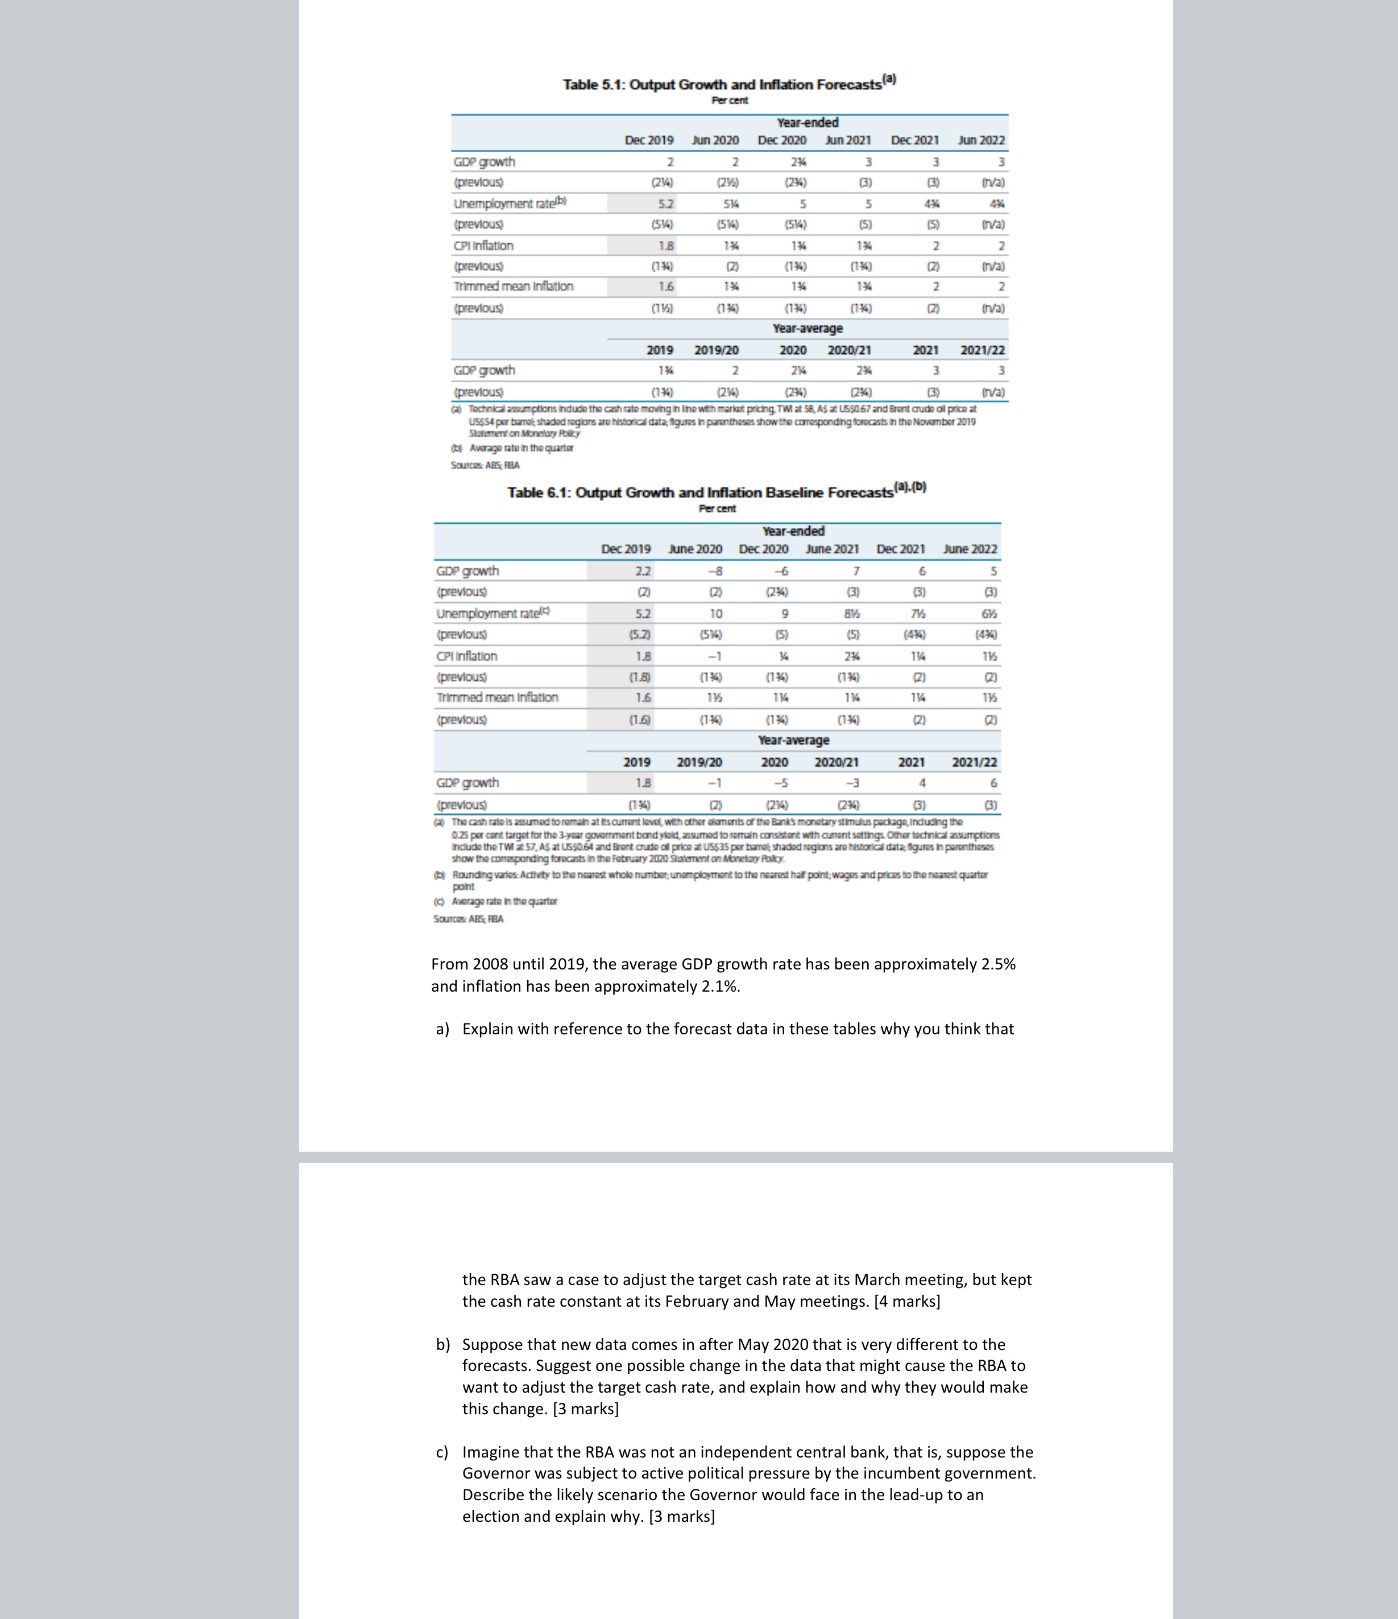
Table 5.1: Output Growth and Inflation Forecasts(2) Percent Year-ended Dec 2019 Jun 2020 Dec 2020 Jun 2021 Dec 2021 Jun 2022 GDP growth (snowand) (234) (2%) (234) Unemployment rate(b) 5.2 5 5 4%% 4% (previous) (534) (5%) (534) (5) CPI Inflation 1.8 2 (snowand) (1%) Trimmed mean Inflation 1.6 2 (previous) (134) Year-average 2019 2019/20 2020 2020/21 2021 2021/22 GDP growth 1%% 2% (previous) (134 (216) (234) (2%) moving in line with market pricing. TWI at 58, AS at US$0 67 and Brent crude oil price at (Va) Statement on Monetary Pokey acasts in the November 2019 Average rate In the quarter SOUNCES ARS FRA Table 6.1: Output Growth and Inflation Baseline Forecasts(3).(b) Percent Year-ended Dec 2019 June 2020 Dec 2020 June 2021 Dec 2021 June 2022 GDP growth 2.2 (2) -8 6 (previous) 1 6 Unemployment ratel 5.2 10 (234) (3) 9 (previous) (5.2) (51) (5) (5) -1 (434) (4%) CPI Inflation 1.8 2% (136) 134 (previous) (136) 115 Trimmed mean Inflation 1.6 116 136 1K 115 (previous) (136) Year-average 2019 2019/20 2020 2020/21 2021 2021/22 GDP growth 18 -1 -5 6 (snowand) (2) (al The cash tate is assumed (236) (234) (3) go, Inducing needs the TW 2 57, AS at US506 show the comesponding forecasts In Handing varies Activity to the nearest most quarter (c) Average rate In the quarter SOURCES ARS PEA From 2008 until 2019, the average GDP growth rate has been approximately 2.5% and inflation has been approximately 2.1%. a) Explain with reference to the forecast data in these tables why you think that the RBA saw a case to adjust the target cash rate at its March meeting, but kept the cash rate constant at its February and May meetings. [4 marks] b) Suppose that new data comes in after May 2020 that is very different to the forecasts. Suggest one possible change in the data that might cause the RBA to want to adjust the target cash rate, and explain how and why they would make this change. [3 marks] c) Imagine that the RBA was not an independent central bank, that is, suppose the Governor was subject to active political pressure by the incumbent government. Describe the likely scenario the Governor would face in the lead-up to an election and explain why. [3 marks]