Question
AO World plc, is planning to expand by acquiring another suitable company from the non-financial services industry. They have identified a company as a suitable
AO World plc, is planning to expand by acquiring another suitable company from the non-financial services industry. They have identified a company as a suitable target. The directors have now approached you as a financial management consultant to recommend a range of prices for the target company using the shareholder value analysis model.
Main question
Using the Rappaport's SVA model and a four-year planning horizon, you are to estimate the values of all the relevant value drivers to calculate the share prices for the company using three different scenarios (the pessimistic scenario, the most likely scenario, and the optimistic scenario).
Required question:
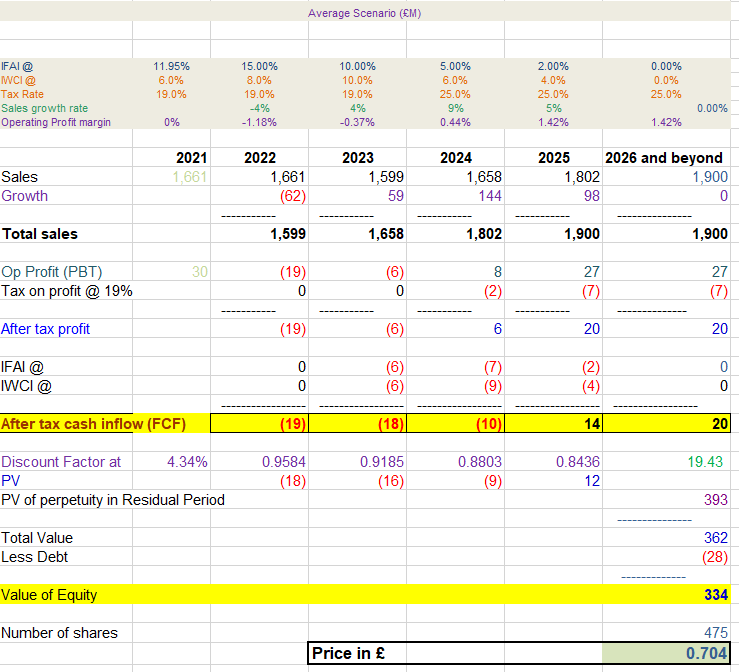
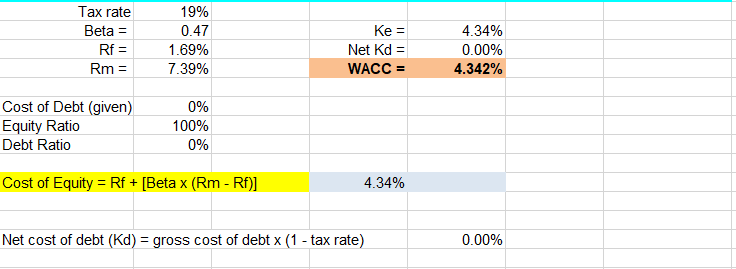
Critically discuss only the pessimistic scenario attached below for the company AO World PLC describing assumptions for the figure changes 2021-2026 Compare it with the average scenario mentioned below.
Average Scenario below;
Bad Scenario below;
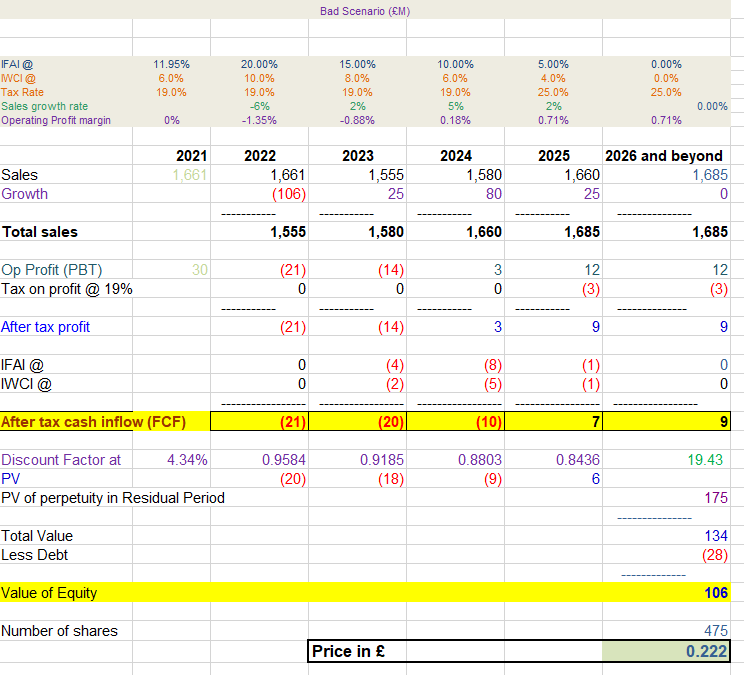
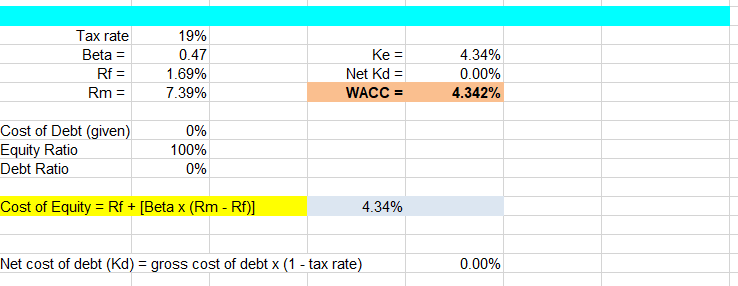
Average Scenario (EM) IFAI @ IWCI@ Tax Rate Sales growth rate Operating Profit margin 11.95% 6.0% 19.0% 15.00% 8.0% 19.0% -4% -1.18% 10.00% 10.0% 19.0% 4% -0.37% 5.00% 6.0% 25.0% 9% 0.44% 2.00% 4.0% 25.0% 5% 1.42% 0.00% 0.0% 25.0% 0.00% 0% 1.42% 2021 1.661 2022 1,661 (62) Sales Growth 2023 1,599 59 2024 1,658 2025 2026 and beyond 1,802 1,900 98 0 144 Total sales 1,599 1,658 1,802 1,900 1,900 30 Op Profit (PBT) Tax on profit @ 19% (19) 0 (6) 0 8 (2) 27 (7) 27 (7) After tax profit (19) (6) 6 20 20 (6) IFAI @ IWCI @ 0 0 (7) (9) (6) (2) (4) 0 0 After tax cash inflow (FCF) (19) (18) (10) 14 20 19.43 Discount Factor at 4.34% PV PV of perpetuity in Residual Period 0.9584 (18) 0.9185 (16) 0.8803 (9) 0.8436 12 393 Total Value Less Debt 362 (28) Value of Equity 334 Number of shares 475 0.704 Price in Tax rate Beta = Rf = Rm = 19% 0.47 1.69% 7.39% Ke = Net Kd = WACC = 4.34% 0.00% 4.342% Cost of Debt (given) Equity Ratio Debt Ratio 0% 100% 0% Cost of Equity = Rf + [Beta x (Rm - Rf)] 4.34% Net cost of debt (Kd) = gross cost of debt x (1 - tax rate) 0.00% Bad Scenario (FM) IFAI @ IWCI@ Tax Rate Sales growth rate Operating Profit margin 11.95% 6.0% 19.0% 20.00% 10.0% 19.0% -6% -1.35% 15.00% 8.0% 19.0% 2% -0.88% 10.00% 6.0% 19.0% 5% 0.18% 5.00% 4.0% 25.0% 2% 0.71% 0.00% 0.0% 25.0% 0.00% 0% 0.71% 2021 1,661 Sales Growth 2022 1,661 (106) 2023 1,555 25 2024 1,580 80 2025 2026 and beyond 1,660 1,685 25 0 Total sales 1,555 1,580 1,660 1,685 1,685 30 Op Profit (PBT) Tax on profit @ 19% (21) 0 (14) 0 3 0 12 (3) 12 (3) After tax profit (21) (14) 3 9 9 IFAI @ IWCI @ 0 0 (4) (2) (8) (5) (1) (1) OO After tax cash inflow (FCF) (21) (20) (10) 9 0.9584 0.8436 19.43 Discount Factor at 4.34% PV PV of perpetuity in Residual Period 0.9185 (18) 0.8803 (9) (20) 175 Total Value Less Debt 134 (28) Value of Equity 106 Number of shares 475 0.222 Price in Tax rate Beta = Rf = Rm = 19% 0.47 1.69% 7.39% Ke = Net Kd = WACC = 4.34% 0.00% 4.342% Cost of Debt (given) Equity Ratio Debt Ratio 0% 100% 0% Cost of Equity = Rf + [Beta x (Rm - Rf)] = 4.34% Net cost of debt (Kd) = gross cost of debt x (1 - tax rate) 0.00% Average Scenario (EM) IFAI @ IWCI@ Tax Rate Sales growth rate Operating Profit margin 11.95% 6.0% 19.0% 15.00% 8.0% 19.0% -4% -1.18% 10.00% 10.0% 19.0% 4% -0.37% 5.00% 6.0% 25.0% 9% 0.44% 2.00% 4.0% 25.0% 5% 1.42% 0.00% 0.0% 25.0% 0.00% 0% 1.42% 2021 1.661 2022 1,661 (62) Sales Growth 2023 1,599 59 2024 1,658 2025 2026 and beyond 1,802 1,900 98 0 144 Total sales 1,599 1,658 1,802 1,900 1,900 30 Op Profit (PBT) Tax on profit @ 19% (19) 0 (6) 0 8 (2) 27 (7) 27 (7) After tax profit (19) (6) 6 20 20 (6) IFAI @ IWCI @ 0 0 (7) (9) (6) (2) (4) 0 0 After tax cash inflow (FCF) (19) (18) (10) 14 20 19.43 Discount Factor at 4.34% PV PV of perpetuity in Residual Period 0.9584 (18) 0.9185 (16) 0.8803 (9) 0.8436 12 393 Total Value Less Debt 362 (28) Value of Equity 334 Number of shares 475 0.704 Price in Tax rate Beta = Rf = Rm = 19% 0.47 1.69% 7.39% Ke = Net Kd = WACC = 4.34% 0.00% 4.342% Cost of Debt (given) Equity Ratio Debt Ratio 0% 100% 0% Cost of Equity = Rf + [Beta x (Rm - Rf)] 4.34% Net cost of debt (Kd) = gross cost of debt x (1 - tax rate) 0.00% Bad Scenario (FM) IFAI @ IWCI@ Tax Rate Sales growth rate Operating Profit margin 11.95% 6.0% 19.0% 20.00% 10.0% 19.0% -6% -1.35% 15.00% 8.0% 19.0% 2% -0.88% 10.00% 6.0% 19.0% 5% 0.18% 5.00% 4.0% 25.0% 2% 0.71% 0.00% 0.0% 25.0% 0.00% 0% 0.71% 2021 1,661 Sales Growth 2022 1,661 (106) 2023 1,555 25 2024 1,580 80 2025 2026 and beyond 1,660 1,685 25 0 Total sales 1,555 1,580 1,660 1,685 1,685 30 Op Profit (PBT) Tax on profit @ 19% (21) 0 (14) 0 3 0 12 (3) 12 (3) After tax profit (21) (14) 3 9 9 IFAI @ IWCI @ 0 0 (4) (2) (8) (5) (1) (1) OO After tax cash inflow (FCF) (21) (20) (10) 9 0.9584 0.8436 19.43 Discount Factor at 4.34% PV PV of perpetuity in Residual Period 0.9185 (18) 0.8803 (9) (20) 175 Total Value Less Debt 134 (28) Value of Equity 106 Number of shares 475 0.222 Price in Tax rate Beta = Rf = Rm = 19% 0.47 1.69% 7.39% Ke = Net Kd = WACC = 4.34% 0.00% 4.342% Cost of Debt (given) Equity Ratio Debt Ratio 0% 100% 0% Cost of Equity = Rf + [Beta x (Rm - Rf)] = 4.34% Net cost of debt (Kd) = gross cost of debt x (1 - tax rate) 0.00%
Step by Step Solution
There are 3 Steps involved in it
Step: 1

Get Instant Access to Expert-Tailored Solutions
See step-by-step solutions with expert insights and AI powered tools for academic success
Step: 2

Step: 3

Ace Your Homework with AI
Get the answers you need in no time with our AI-driven, step-by-step assistance
Get Started


