Apart from the property cash flows and rent rolls, identify and critically evaluate other items that should be included in any due diligence to facilitate
Apart from the property cash flows and rent rolls, identify and critically evaluate other items that should be included in any due diligence to facilitate an investment decision.
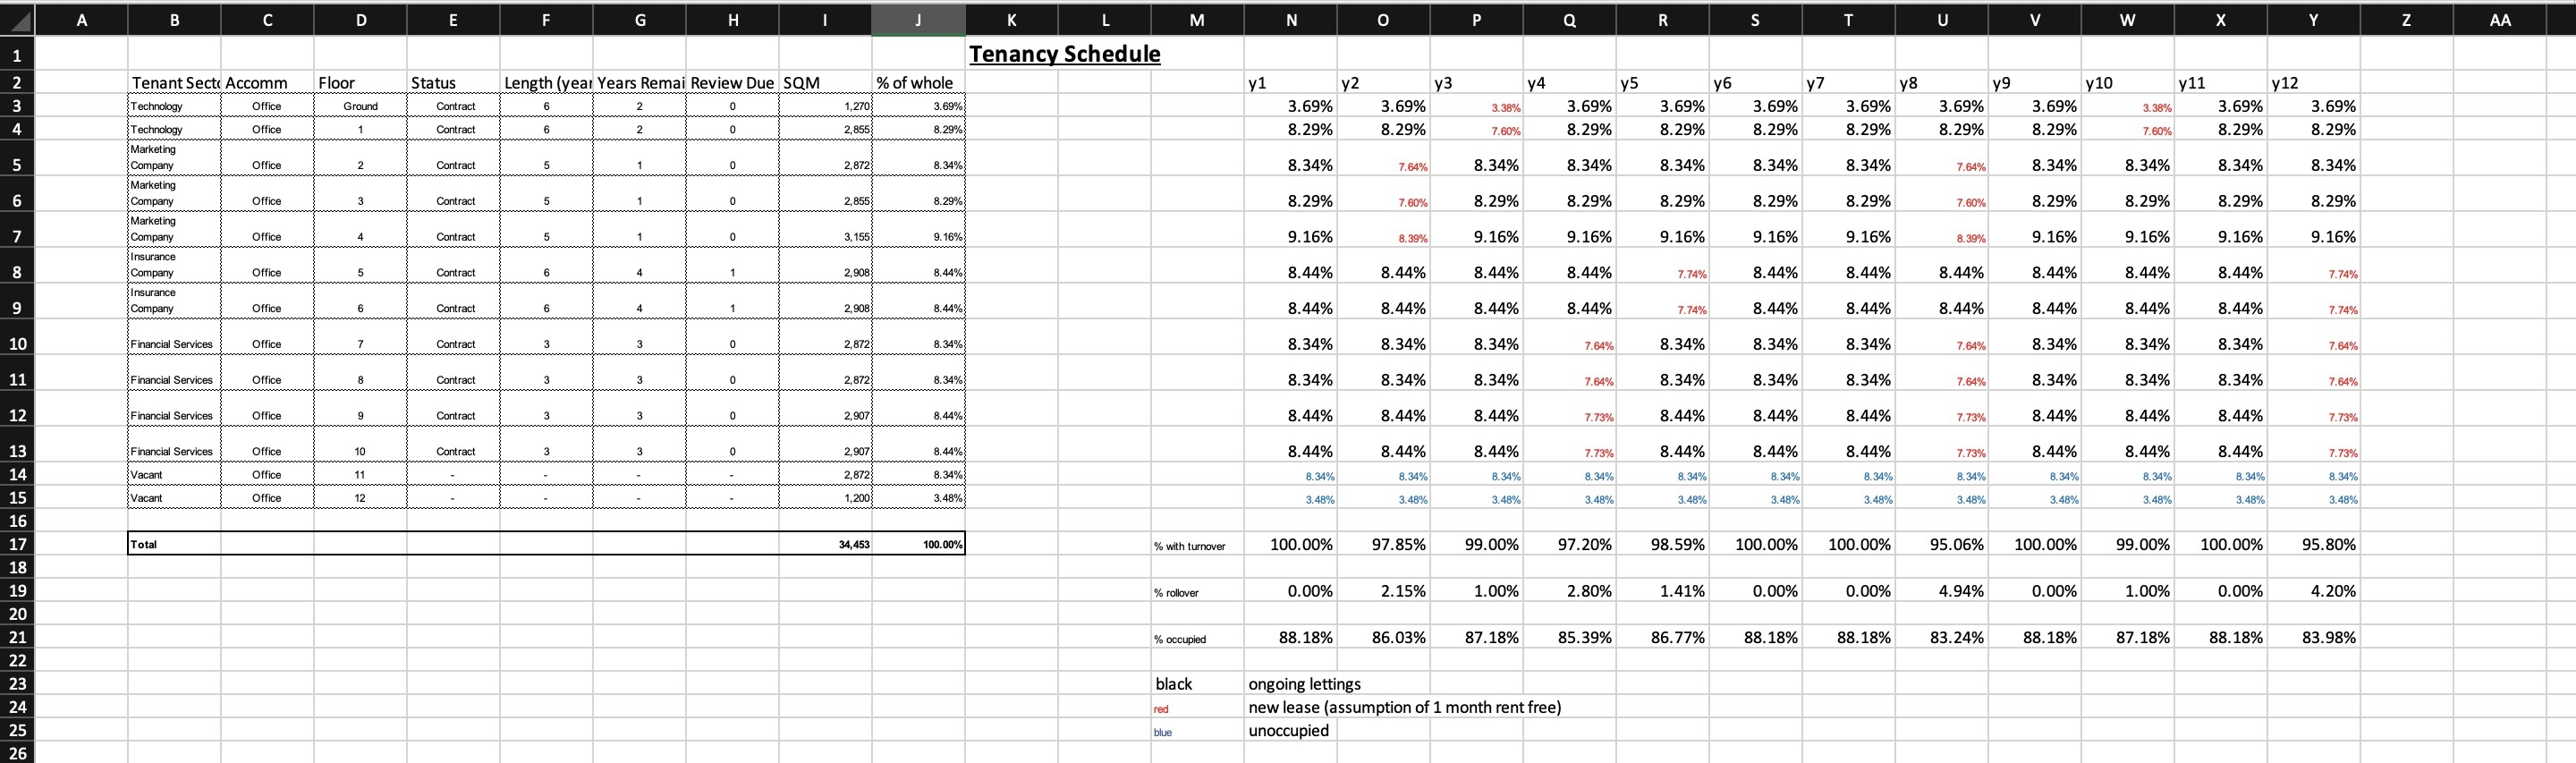
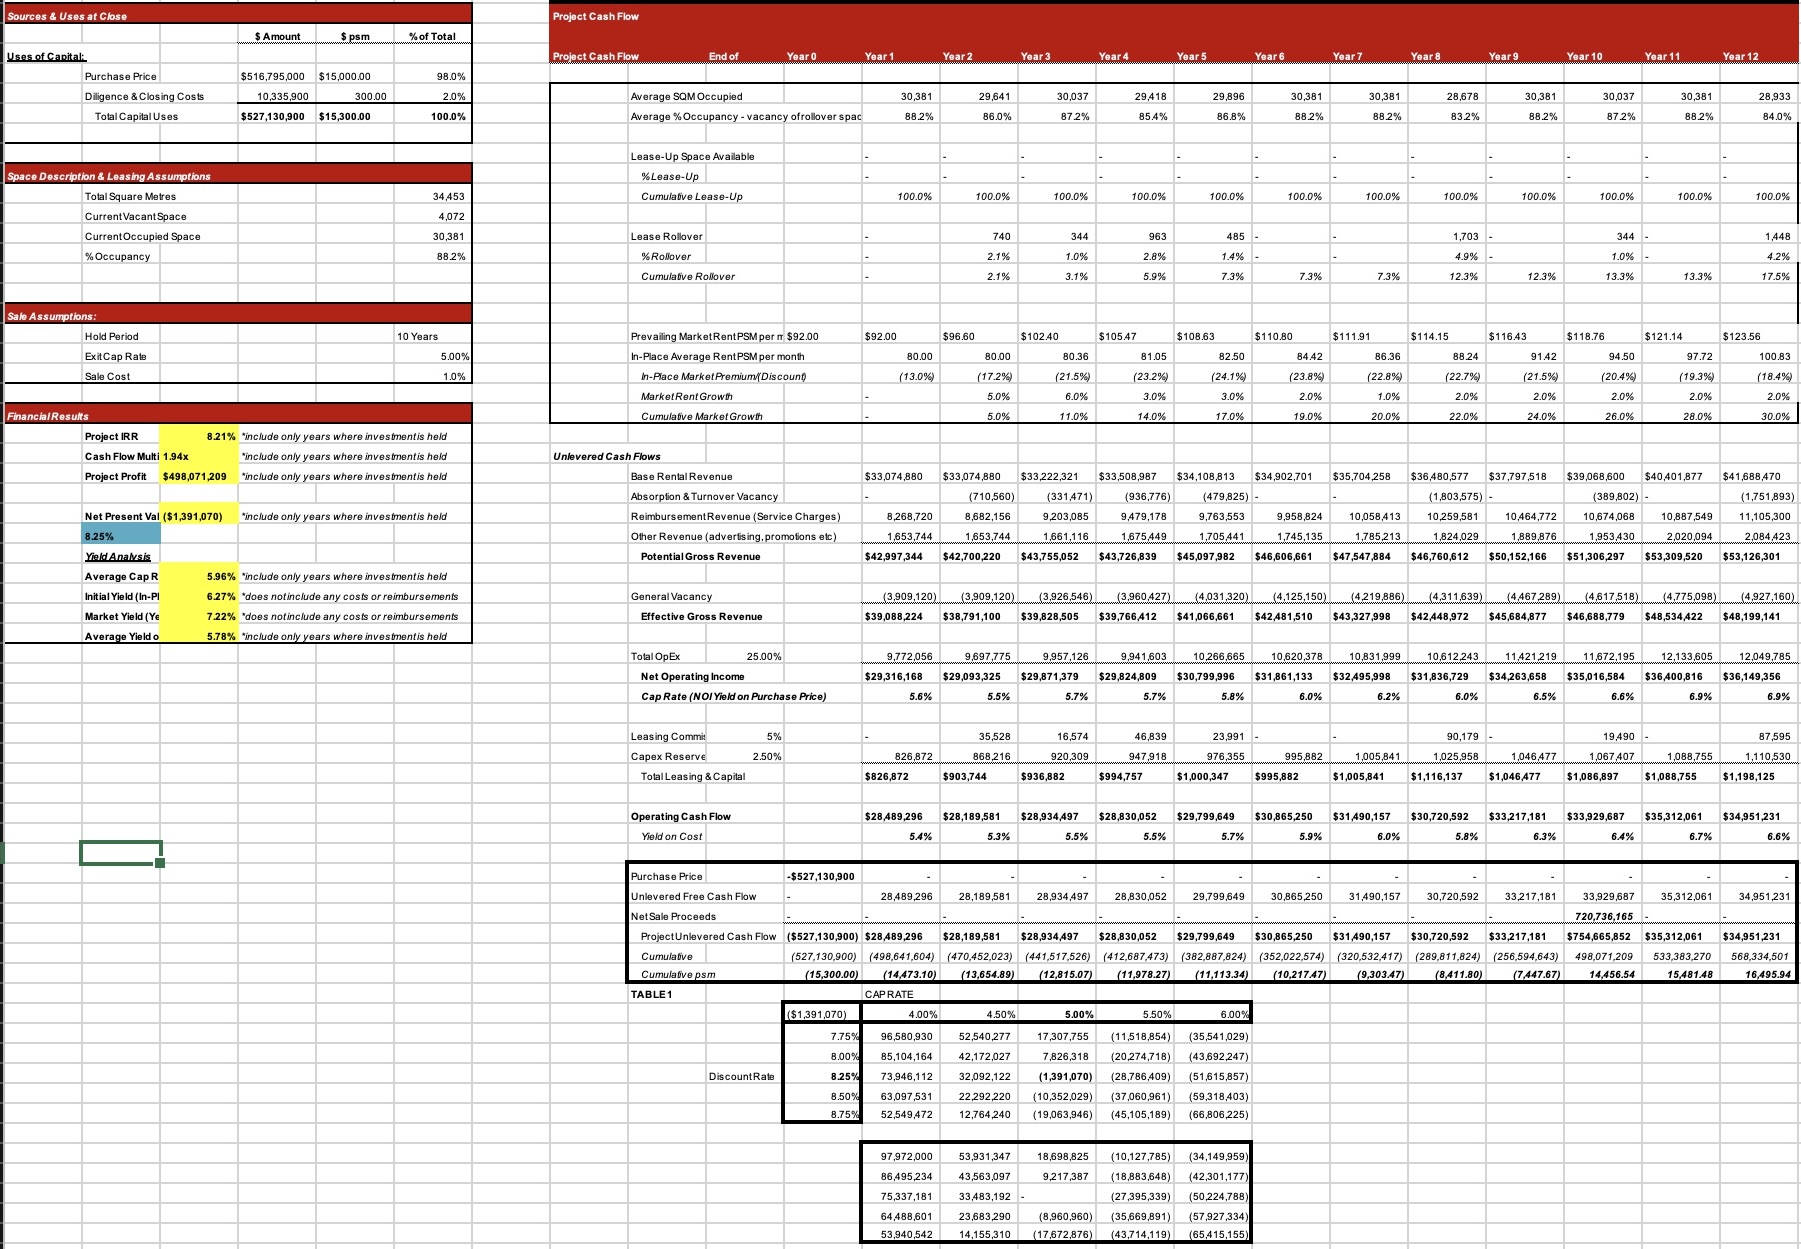
W D H M O Q U AA Tenancy Schedule V4 y5 y6 y7 y8 y9 y10 y11 y12 Tenant Sect Accomm Floor Status Length (year Years Remai Review Due SQM % of whole y1 y2 y3 3.69% 3.69% Technology Office Ground Contract 1,270 3.69% 3.69% 3.69% 3.38% 3.69% 3.69% 3.69% 3.69% 3.69% 3.69% 3.38% Office Contract 2.855 8.29% 8.29% 8.29% 7.609 8.29% 8.29% 8.29% 8.29% 8.29% 8.29% 7.609 8.29% 8.29% Technology Marketing 2,872 8.34% 3.34% 7.64% 8.34% 8.34% 8.34% 8.34% 8.34% 7.64% 8.34% 8.34% 8.34% 8.34% 5 Company Office Contract Marketing 8.29% 7.60% 8.29% 8.29% 8.29% 8.29% 6 8.29% Company 2,855 8.29% 8.29% 7.60% 8.29% 8.29% 8.29% Office Contract Marketing 9.16% 9.16% 9.16% 9.16% 9.16% 9.16% 9.16% 9.16% 9.16% Company Office Contract 3, 155 9. 16% 9.16% Insurance Office Contract 2,908 8.44% 8.44% 8.44% 3.44% 8.44% 7.74% 8.44% 8.44% 8.44% 8.44% 8.44% 8.44% 7.74% Company Insurance Office Contract 2,908 8.44% 8.44% 8.44% 8.44% 8.44% 7.74% 8.44% 8.44% 8.44% 8.44% 8.44% 8.44% 7.74% 9 Company Financial Services Office Contract 2872 8.34% 8.34% 8.34% 8.34% 7.64% 8.34% 8.34% 8.34% 7.64% 8.34% 8.34% 8.34% 7.64% 10 Contract 2,872 8.34% 3.34% 8.34% 3.34% 8.34% 8.34% 8.34% 7.64% 8.34% 8.34% 8.34% 7.64% 11 Financial Services Office 7.64% 8.44% 8.449 8.44% 7.73% 12 Financial Services Office Contract 2.807 8.44% 8.44% 8.44% 3.44% 7.73% 8.44% 8.44% 8.44% 7.73% 2.307 8.446 8.44% 8.44% 8.44% 7.73% 8.44% 8.44% 8.44% 7.73% 8.44% 8.44% 8.44% 7.73% 13 Financial Services Office Contract 2,872 8.34%% 8.34% 8.34% 8.34% 8.34% 8.34% 8.34% 8.34% 8.34% .34% 8.349% 8.349% 8.34% Vacant Office 1,200 3.48% 3.48% 3.48% 3.48% 3,48% 3.48% 3.48% 3.48% 3.48% 3.48% 3.48% 3.48% 3.48% Vacant Office 34,453 100.00% % with turnover 100.00% 97.85% 99.00% 97.20% 98.59% 100.00% 100.00% 95.06% 100.00% 99.00% 100.00% 95.80% Total % rollover 0.00% 2.15% 1.00% 2.80% 1.41% 0.00% 0.00% 4.94% 0.00% 1.00% 0.00% 4.20% % occupied 88.18% 86.03% 87.18% 85.39% 86.77% 88.18% 88.18% 83.24% 88.18% 87.18% 88.18% 83.98% black ongoing lettings red new lease (assumption of 1 month rent free) blue unoccupiedurces & Uses at Close Project Cash Flow $ Amount Spam % of Total Uses of Capital: Project Cash Flow End of Year 0 Year 1 Year 2 Year 3 Year 4 Year 5 Year 6. Year 7 Year 8 Year 9 Year 10 Year 11 Year 12 Purchase Price $516,795,000 $15,000.00 98.0% Diligence & Closing Costs 10,335,900 300.00 2.0% Average SQM Occupied 30,381 29,641 30,037 29,418 29,896 30,381 30,381 28,678 30,381 30,037 30,381 28,933 Total Capital Uses $527,130,900 $15,300.00 100.0% Average % Occupancy - vacancy ofrollover spac 88.2% 86.0% 87 2% 85.4% 86.8% 88.2% 88.2% 83.2% 88.2% 87 2% 88.2% 84.0% ease-Up Space Available Space Description & Leasing Assumption % Lease-Up Total Square Metres 34,453 Cumulative Lease-Up 100.0% 100.0% 100.0% 100.0% 100.0% 100.0% 100.0% 100.0% 100.0% 100.0% 100.0% 100.0% CurrentVacant Space 4,072 Current Occupied Space 30,381 ease Rollover 740 344 963 485 1,703 344 1,44 % Occupancy 88.2% % Rollover 2.1% 1.0% 2.8% 1.4% - 4.9% 1.0% 4.2% Cumulative Rollover 2.1% 3.1% 5.9% 7.3% 7.3% 7.3% 12.3% 12.3% 13.3% 13.3% 17.5% Sale Assumptions: Hold Period 10 Years Prevailing MarketRentPSM per m $92.00 $92.00 $96.60 $102.40 $105.47 $108.63 $110.80 $111.91 $114.15 $116.43 $118.76 $121.14 $123.56 Exit Cap Rate 5.00% In-Place Average RentPSM per month 80.00 80.00 80.36 81.05 82.50 84.42 86.36 88.24 91.42 94.50 97.72 100.83 Sale Cost 1.0% In-Place MarketPremium(Discount) (13.0%) (17.2%) (21.5% (23.2% (24.1%) (23.0%%) (22.8%) (22.7%) (21.5% (20.4%) (19.3%) (18.4% MarketRent Growth 5.0% 6.0% 3.0% 3.0% 2.0% 1.0% 2.0% 2.0% 2.0% 2.0% 2.0% hancial Results Cumulative Market Growth 11.0% 14.0% 17.0% 19.0% 20.0% 22.0% 24.0% 26.0% 28.0% 30.0% Project IRR 8.21% "include only years where investmentis held Cash Flow Multi 1.94x "include only years where investmentis held Unlevered Cash Flows Project Profit $498,071,209 "include only years where investmentis held Base Rental Revenue $33,074,880 $33,074,880 $33,222,321 $33,508,987 $34,108,813 $34,902,701 $35,704,258 $36,480,577 $37,797,518 $39,068,600 $40,401,877 $41,688,470 Absorption & Turnover Vacancy (710,560) (331471) (936,776) (479,825) (1,803,575) (389,802) (1,751,893 Net Present Val ($1,391,070) "include only years where investmentis held ReimbursementRevenue (Service Charges) 8,268,720 8,682.156 9,203,085 9.479,178 9,763,553 9,958,824 10,058,413 10,259.581 10,464,772 10,674.068 10,887 .549 11,105,30 8.25% Other Revenue (advertising, promotions etc) 1 653 744 1 653.744 1 675.449 1 705 44 1 1 745.135 1 785213 1 824 029 1 889 876 1 953430 2 020.094 2084 423 Yield Analysis Potential Gross Revenue $42,997,344 $42,700,220 $43,755,052 $43,726,839 $45,097,982 $46,606,661 $47,547,884 $46,760,612 $50,152,166 $51,306,297 $53,309,520 $53,126,30 Average Cap R 5.96% "include only years where investmentis held Initial Yield (In-P 6.27% "does not imbursements General Vacancy "(3909.120) .(3.909.120) .(3 926 546) . (3,960 427) . (4 031 320) (4 125.150) (4 219886) (4 311639) (4 467 289)(4617518) (175098) (4927 160) Market Yield (Ye 7.22% "does notinclude bursements Effective Gross Revenue $39,088,224 $38,791,100 $39,828,505 $39,766,412 $41,066,661 $42,481,510 $43,327,998 $42448,972 $45,684,877 $46,688,779 $48,534,422 $48,199,141 Average Yield o mentis held Total Op Ex 25.00% 9.772.056 9.697 775 wow9.957-126 9 941 603 10 266 565 10.620.378 10831 999 10512 243 11421219 11.872.195 12.133 605 wow1.2.049.785 Net Operating Income $29,316,168 $29,093,325 $29,871,379 $29,824,809 $30,799,996 $31,861,133 $32,495,998 8 $31,836,729 $34,263,658 $35,016,584 $36,400,816 $36,149,356 Cap Rate (NOI Yield on Purchase Price) 5.6% 5.5% 5.7% 5.7% 5.8% 6.0% 6.2% 6.0% 6.5% 6.6% 6.9% 6.9% Leasing Commi 5% 35,528 16,574 46,839 23,991 - 90,179 19490 - 87,595 Capex Reserve 2.50% 826,872 868 216 920 309 947 918 976 355 995,882. 1,005,841 1 025 .958. 1 046 477 1,067 407 1,088,755 1.1 10 530 Total Leasing & Capital $826,872 $903,744 $936,882 $994,757 $1,000,347 $995,882 $1,005,841 $1,116,137 $1,046477 $1,086,897 $1,088,755 $1,198,125 Operating Cash Flow $28,489,296 $28,189,581 $28,934,497 $28,830,052 $29,799,649 $30,865,250 $31,490,157 $30,720,592 $33,217,181 $33,929,687 $35,312,061 $34,951,231 Yield on Cost 5.4% 5.3% 5.5% 5.5% 5.7% 5.9% 6.0% 5.8% 6.3% 6.4% 6.7% 6.6% Purchase Price -$527,130,900 Unlevered Free Cash Flow 28,489,296 28,189,581 28,934,497 28,830,052 29,799,649 30,865,250 31,490,157 30,720,592 33,217,181 33,929,687 35,312,061 34,951,231 NetSale Proceeds 720.736.165 ProjectUnlevered Cash Flow ($527,130,900) $28,489,296 $28,189,581 $28,934,497 $28,830,052 $29,799,649 $30,865,250 $31,490,157 $30,720,592 $33,217,181 $754,665,852 $35,312,061 $34,951,231 Cumulative (527,130,900) (498,641,604) (470,452,023) (441,517.526) (412.687,473) (382,887.824) (352,022.574) (320.532,417) (289.811,824) (256,594.643) 498,071.209 533,383,270 568,334,501 Cumulative psm (15,300.00) (14,473.10) (13.654.89) (12,815.07) (11,978.27) (11.113.34) (10,217 47) (9,303.47) (8411.80) (7 447.67) 14,456.54 15,481.48 16,495.94 TABLE 1 CAP RATE ($1,391,070) 4.00% 4.50% 5.00% 5.50%% 6.00% 7.75%% 96,580,930 52,540,277 17 307,755 (11,518,854) (35,541,029) 8.00% 85,104,164 42,172,027 7 ,826,318 (20,274.718) (43,692,247) DiscountRate 8.25% 73,946,112 32,092,122 (1,391,070) (28786,409) (51.615,857) 8.50% 63,097,531 22,292,220 (10,352,029) (37,060.961) (59,318,403) 8.75%% 52,549,472 12,764 240 (19,063,946) (45,105,189) (66,806,225) 97,972,000 53,931,347 18,698,825 (10,127,785) (34,149,959 86,495,234 43,563,097 9,217,387 (18,883,648) (42,301,177) 75,337,181 33,483,192 (27 ,395,339) (50.224,788) 64,488,601 23,683,290 (8,960,960) (35,669,891) (57 ,927,334) 53,940,542 14,155,310 (17.672,876) (43,714,119) (65,415,155)
Step by Step Solution
There are 3 Steps involved in it
Step: 1
Get Instant Access to Expert-Tailored Solutions
See step-by-step solutions with expert insights and AI powered tools for academic success
Step: 2
Step: 3
Ace Your Homework with AI
Get the answers you need in no time with our AI-driven, step-by-step assistance