Question
Apparatus: Aluminum track and supports, PASCO Smart Cart, two cart stops (one for each end of track). Objectives: 1) To be able to define acceleration
Apparatus: Aluminum track and supports, PASCO Smart Cart, two cart stops (one for each end of track). Objectives: 1) To be able to define acceleration and determine its sign.
2) To connect the signs of velocity and acceleration with speeding up and slowing down motions.
3) To understand the relationships between position and velocity vs. time graphs and acceleration. Part A: Set-up and Coordinate System When the cart is set into motion on an inclined aluminum track, it will move with a constant acceleration that depends on the angle of the track with the horizontal. By giving a small push to start it, the cart can be made to move either toward or away from the cart stop at top of the incline. In each case, the Smart Cart sensors will capture the motion of the cart and Capstone software will plot position vs. time, and velocity vs. time on the computer. Take a look at the smart cart. Smart cart has a built in coordinate system such that any starting position on the track may be assumed as the origin. This coordinate system is shown on the cart as x,y,z directions. Therefore, if the cart moves in the direction shown on the cart's +x direction, it considers positions as positive positions and if the cart moves in the backward direction (-x), it considers positions as negative. Thus, positive and negative positions are determined based on how you align the cart's motion with its printed coordinate system. Once you select the + direction of velocity then, throughout the experiment (parts A through F) you should never change that orientation.
Select the orientation of the cart as the following that is kept fixed throughout the experiment
Front of the cart or +x axis is pointing at the bottom cart stop.
Moving direction ............................ Sign of positions ............................. Sign of velocity
1. Moving down the incline
2. Moving up the incline
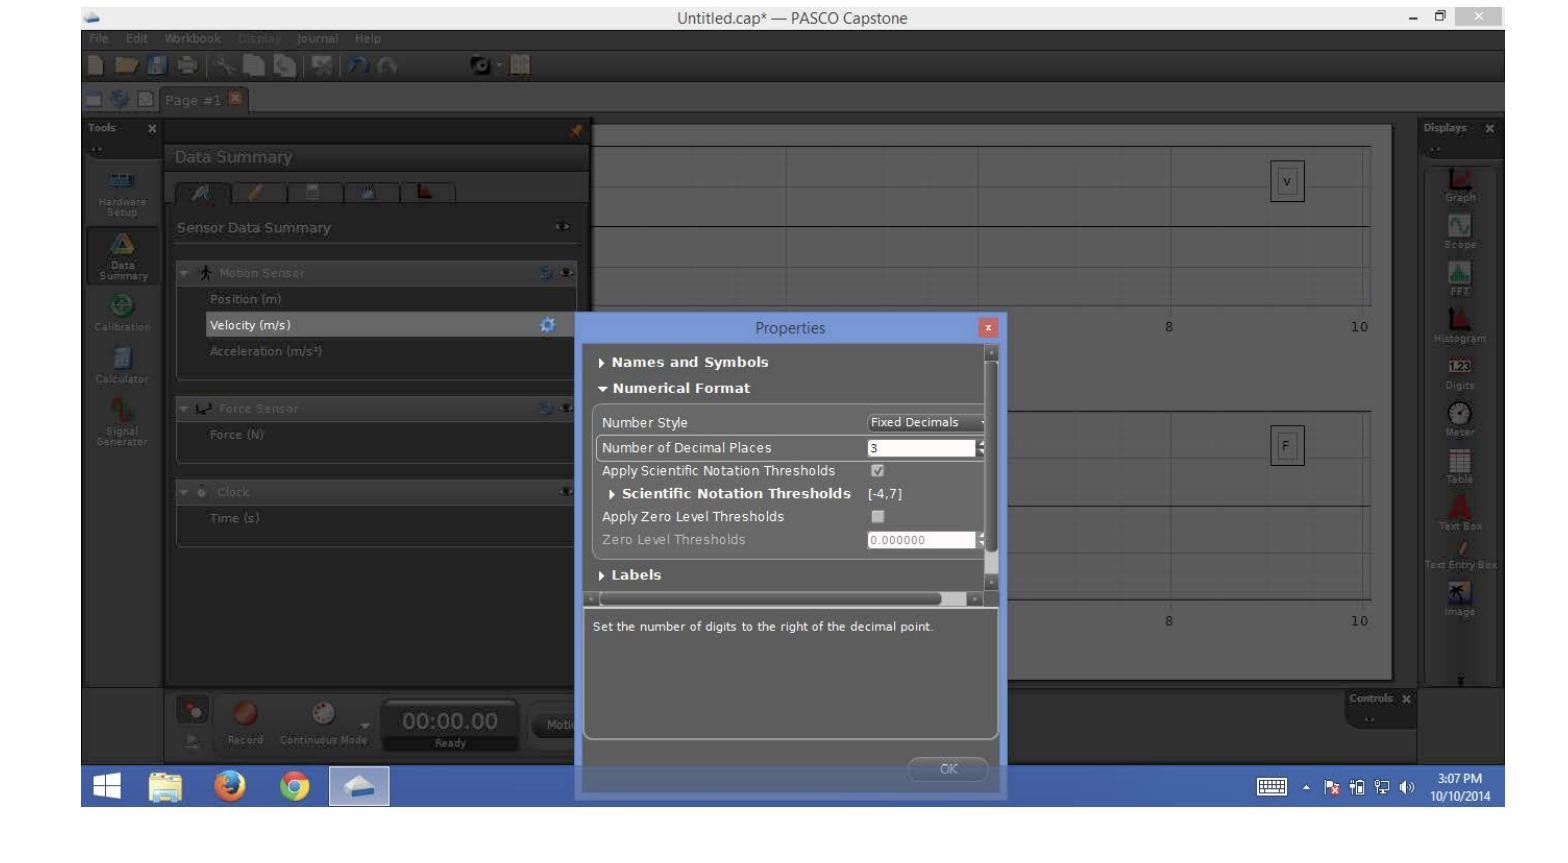
Part B: Equipment set-up and practice Set up your cart and track . Launch Capstone on your computer. Then start a new experiment and select "two displays." Each Smart Cart has a number and make sure to select the correct Smart Cart by matching the Smart Cart number to connect the carts to the software. Select one display to be a graph and select position as the measurement. Select the other display to be a graph of velocity. Set the number of decimal places to 3 for each variable by choosing Data Summary on the left side menu bar and selecting the Properties for each measurement then selecting Numerical Format. After changing Number of Decimal Places to 3, click OK and proceed to the Properties for the next variable.
Take some practice data while carefully moving the cart on the incline with cart +x direction pointed downward as explained above.

Step by Step Solution
There are 3 Steps involved in it
Step: 1

Get Instant Access to Expert-Tailored Solutions
See step-by-step solutions with expert insights and AI powered tools for academic success
Step: 2

Step: 3

Ace Your Homework with AI
Get the answers you need in no time with our AI-driven, step-by-step assistance
Get Started


