Question
Appendix 1: Tech-Trace High-level Data Integration Process Narrative The following is a documentation of a pilot study into the viability of the Tech-Trace software across
Appendix 1: Tech-Trace High-level Data Integration Process Narrative The following is a documentation of a pilot study into the viability of the Tech-Trace software across White Niles supply chain, including the data integration process thereof. Detailed process flow diagrams depicting the pilot study can be obtained from the Tech-Trace Traceability Solution Pilot Program file. Contact the Tech-Trace Support Team to request access. Please be aware that we at Tech-Trace are constantly looking to evolve and develop our product. If you require adjustments to our software to ensure that it meets your requirements, please contact our team. Note: Blockchain is still a new technology with limited examples to refer to. It is not possible to write product specifications prior to development. This process was developed to accelerate the pilot testing of the Tech-Trace software. It is currently under review to determine a tailored process traceability design for White Niles supply chain. Supply chain data integration At the source, rough diamonds are recovered from open-pit mines and transported to a plant to begin the processes required to separate rough diamonds from the surrounding waste rock. Final measuring and sorting processes are then conducted by trained staff. Each stone is examined and grouped mainly according to colour, clarity and size. Only gem-quality stones are sold down the jewellery production chain. The rough miner uses the Tech-Trace App to create a unique blockchain-encrypted QR code, which incorporates a unique hash value at the time of its generation. The rough miner encodes details of the roughs origin, including name and geolocation of the mine, Kimberley Process certification details (Kimberley Process is an international process that reduces conflict diamonds, which are rough diamonds that are used to finance wars against governments around the world) and additional information, such as the environmental, industrial and social history of the rough, and stores the timestamped data on the tamper-proof blockchain, which returns a hash value. The rough miner prints the QR code with this hash value and attaches the QR code to the rough diamonds to be sold. Nodes (participants) in the pilot study have not agreed on what information to store on the blockchain due to concerns regarding privacy of the data. They have also not been able to agree with the format, access rights and the governance of the distributed ledger. The sheer volume and complexity of data stored in the distributed ledgers have necessitated significant computing resources, which have caused some of the operations of the solution, such as reading from the blockchain, to be significantly slower compared to traditional databases. Further, the distributed ledger function does not work when a network connection has been lost. Any tampering with data stored in IoT devices during the offline period will likely go undetected. As the mines are in remote areas, failed internet network connections have occurred. The rough diamonds are sold and transported to White Nile under an offtake agreement (or long-term contract) which obligates White Nile to purchase a portion of the mines production. At White Niles manufacturing facility, roughs are professionally cut and polished into diamonds. In the planning stage, the cutter determines the most appropriate shape of each diamond to minimise waste and maximise the yield of the stone, and accurate measurements are generated using mapping machines and three-dimensional models. The rough is then cleaved into separate pieces to allow the cutter to work on the pieces separately and use the rough most efficiently. Mechanical sawing and laser technology are then applied to shape the diamonds. Through the process of girdling and polishing, smooth and reflective faceted diamonds are produced. The diamonds are then inspected to ensure they meet specifications and quality control standards, and then graded where appropriate. White Nile scans the QR code attached to the original roughs using the Tech-Trace App. When the blockchainencrypted QR code is scanned, the Tech-Trace system verifies the hash value by comparing the hash value of the blockchain with the hash value of the QR code. If the two hash values match, then access to data is authorised. White Nile encodes information about the polished diamonds (such as cutting and polish support) and stores the information in the distributed ledgers and the hash value of the block, to which new data is added into the next block, which returns a unique hash value. This makes the system highly secure. White Nile then prints its own QR code with the unique hash value and attaches the QR code to the polished diamonds to be sold. To ensure that the diamonds are compliant with the information stored in distributed ledgers, White Nile photographs every diamond it processes, and the image files are stored as blockchain data. As some stones look identical and are difficult to differentiate in photographs (for example, melee diamonds, which are tiny diamonds that typically weigh less than 0.15 carat and are usually sold in parcels sorted according to their carat weight), some errors have occurred as the photographs are manually matched to the diamonds. As blockchain data is immutable, it has not been possible to correct any errors in diamond identification without making significant changes to the data structure. Further, because White Nile already uses normal barcode technologies in its product management systems, the new-format Tech-Trace QR code has caused incompatibility issues and system problems. Significant resources have been required to rectify the issues and significant downtime has been required to maintain White Niles systems. After being processed by White Nile, polished diamonds are sold and delivered to Louis Edgar based on the terms of their exclusive supply agreement. On receiving a diamond from White Nile, Louis Edgar scans the QR code using Tech-Trace App and encodes timestamped delivery details and stores the data on the blockchain. Data volumes on the blockchain are very large and frequently overwhelms Louis Edgars systems. To safeguard sensitive supply chain data, only information about a diamonds origin, journey and gemological grading are produced onto the diamonds unique report using Tech-Traces access restriction features. The report can be viewed by anyone via smartphone.
Dataset
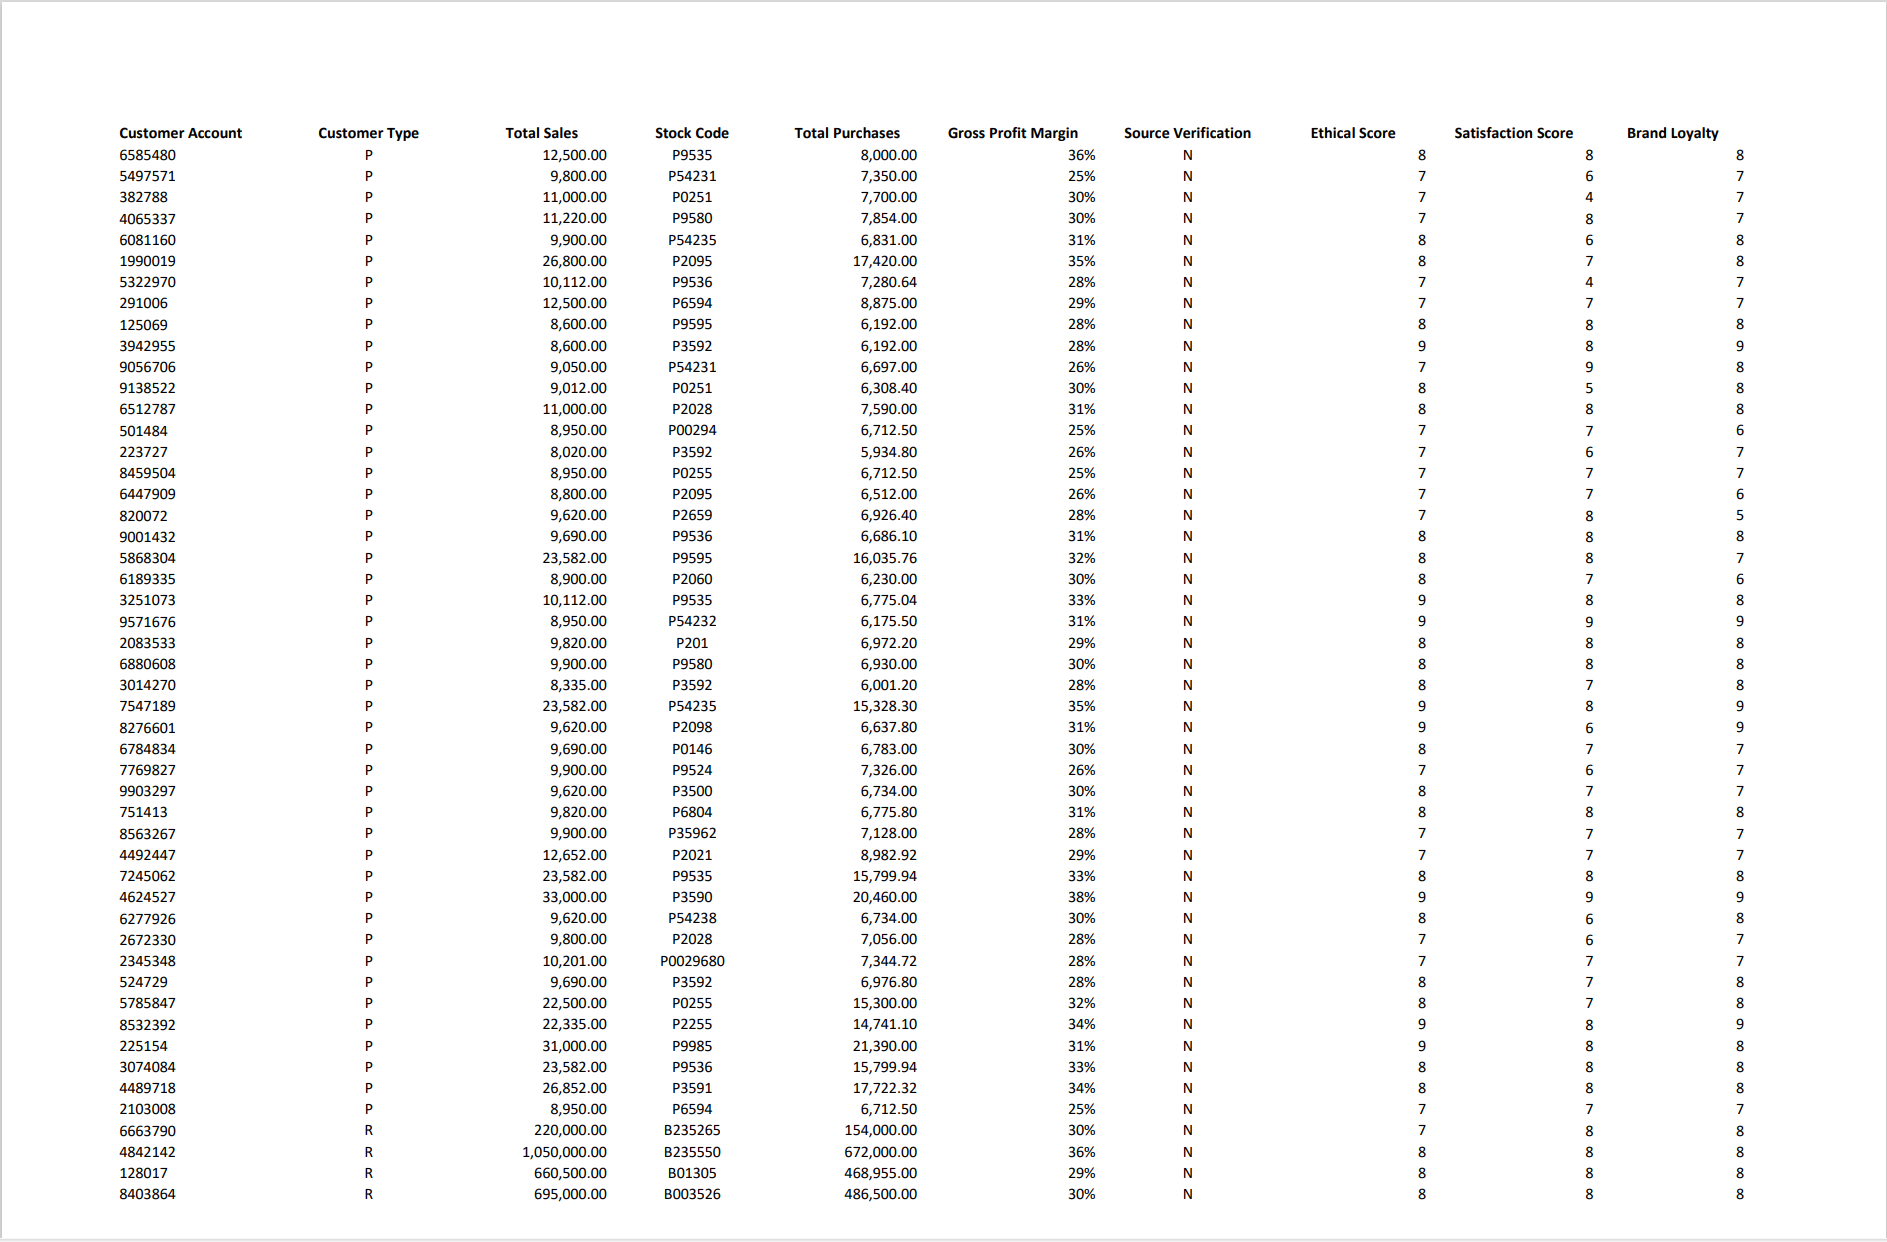
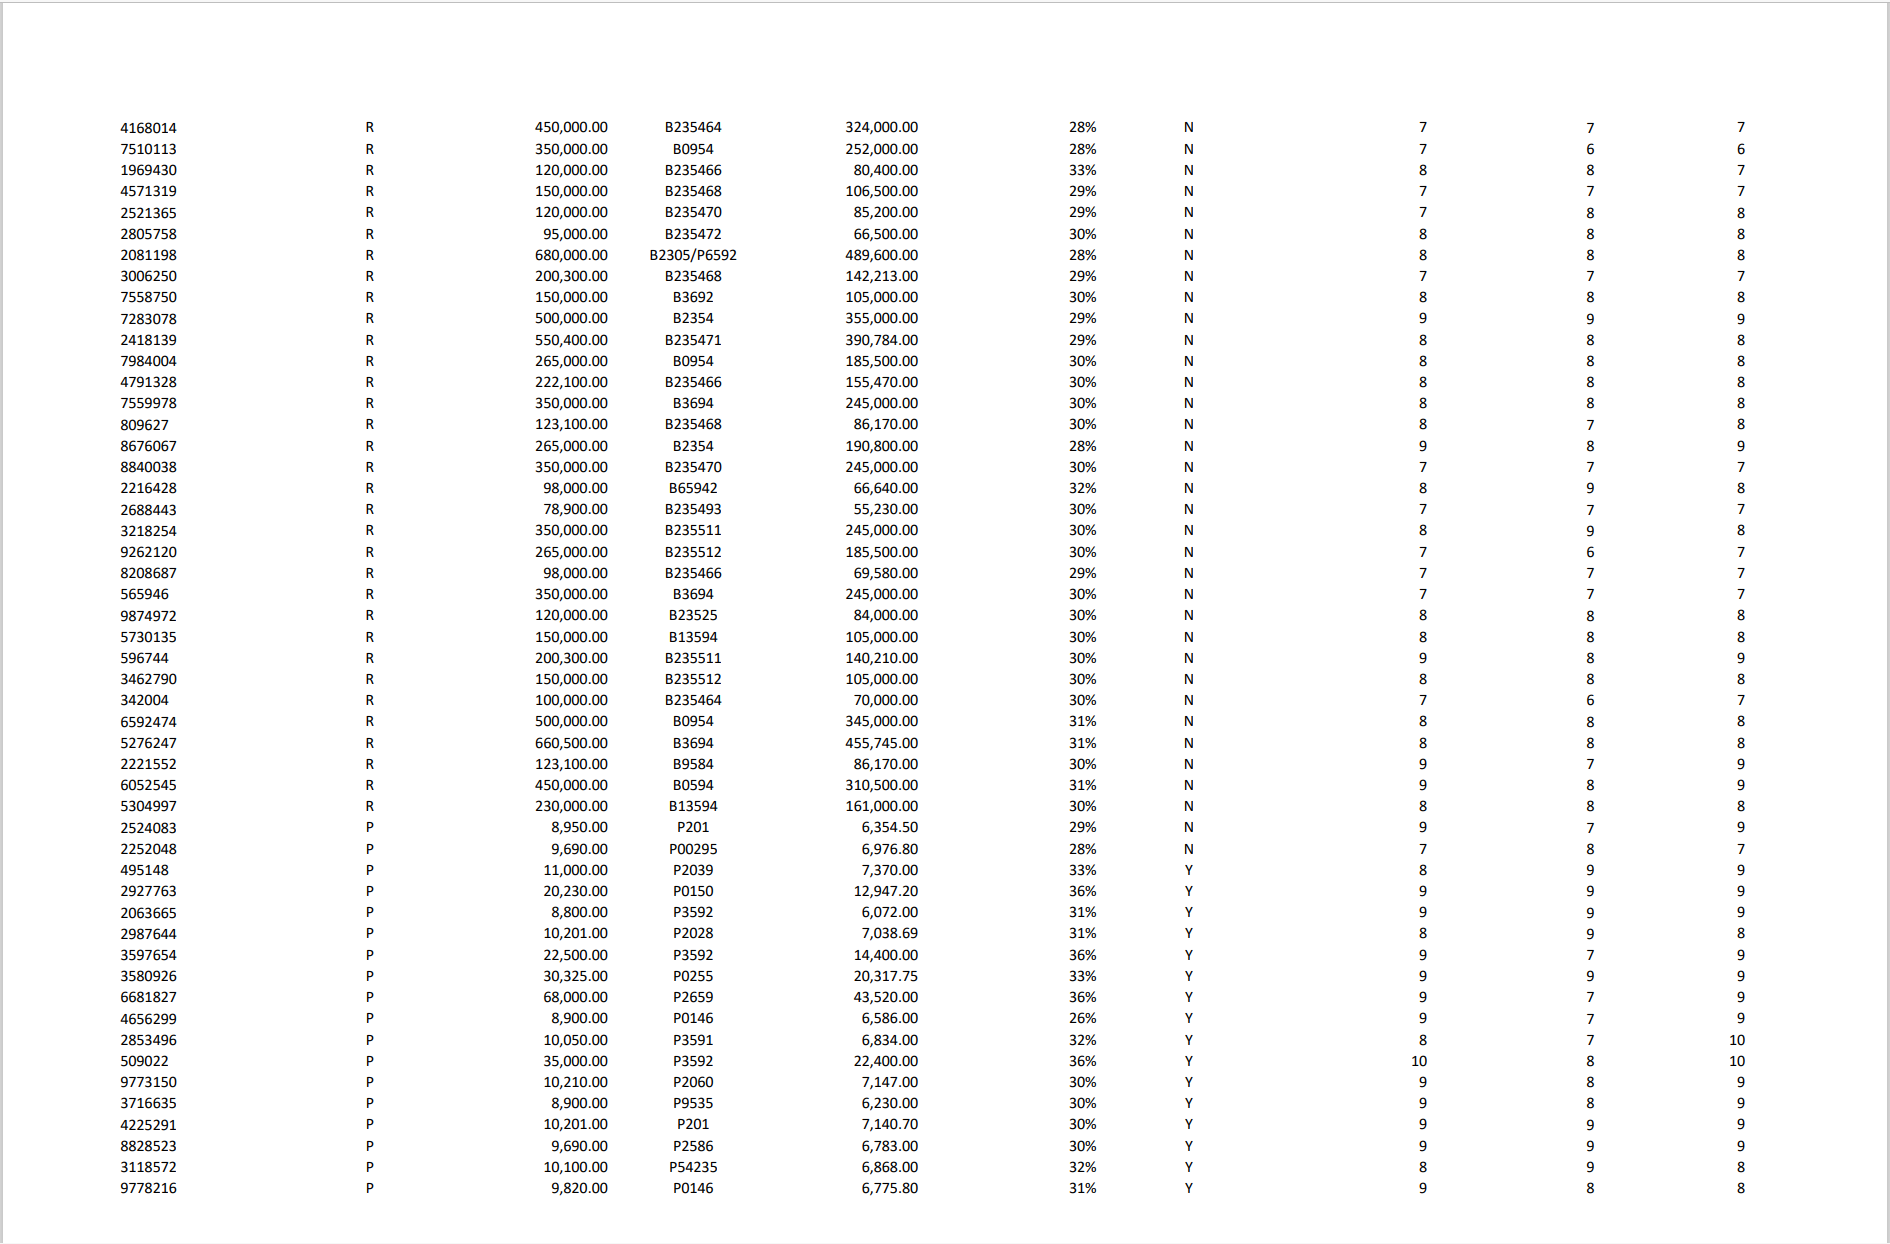
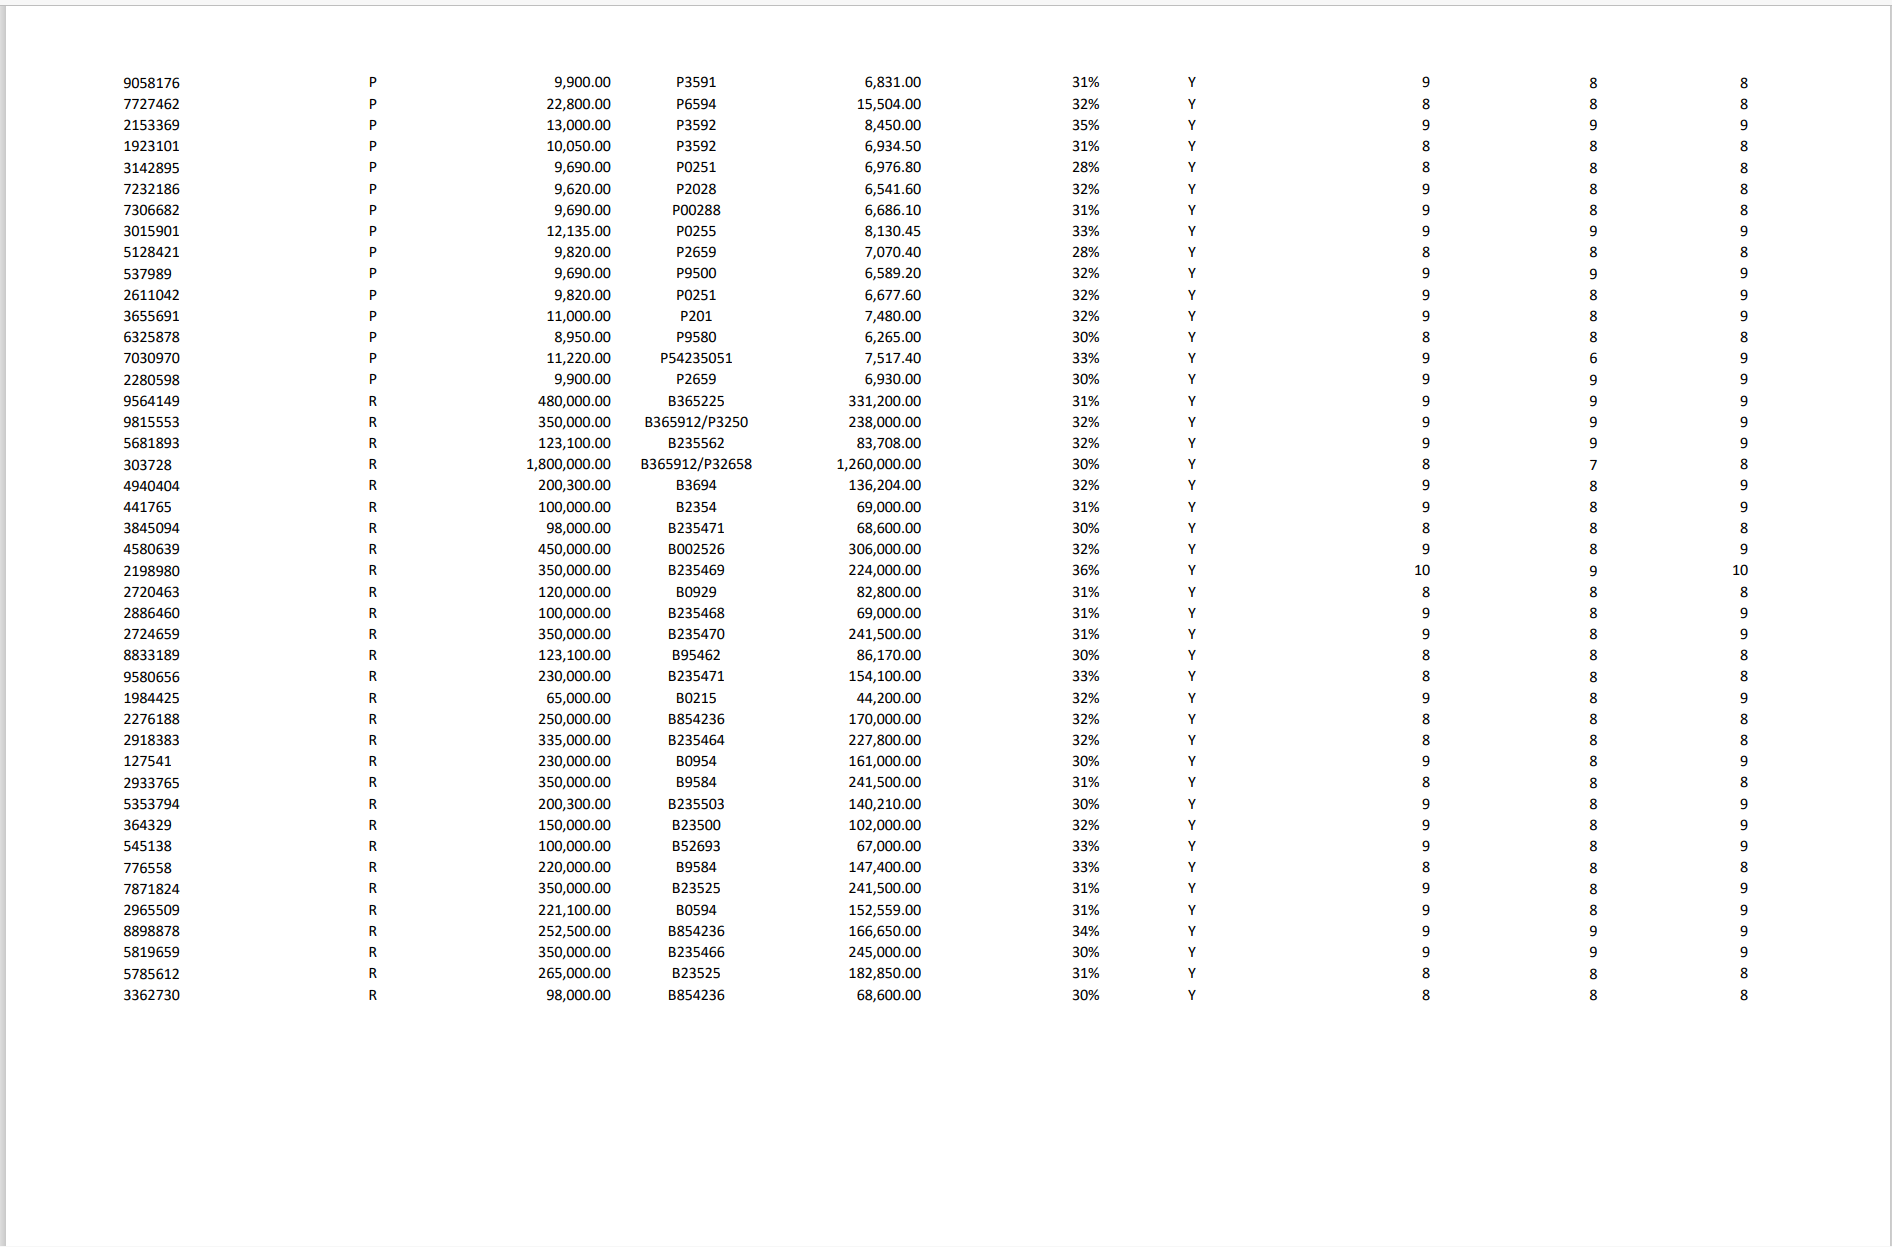
Variable Descriptions

Numerical Analysis
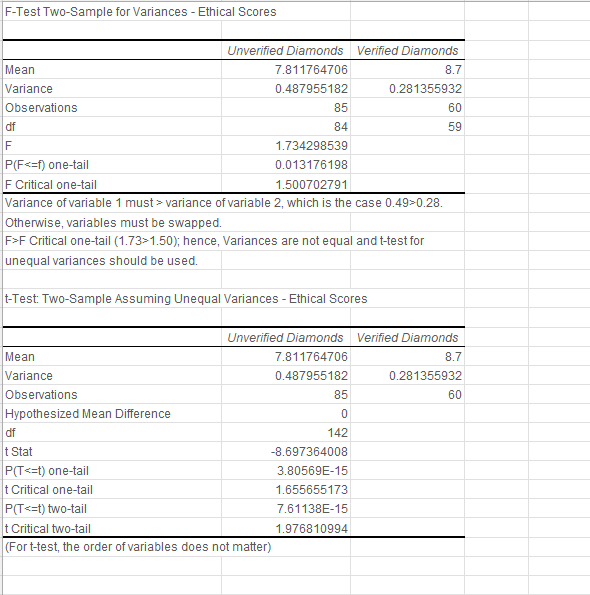
Summary Statistics
Required Task 1: The FD believes that origin-verified diamonds (herein called verified diamonds) are, on average, more profitable than unverified diamonds. He has asked how the data from Louis Edgars management application systems could be examined to test if his understanding is correct. (a) Using the details contained in the dataset, determine which two variables would be best to compare to determine whether verified diamonds are more profitable than unverified diamonds. (b) Identify and justify an inferential statistical method you could use to analyse the profitability of verified diamonds compared to unverified diamonds. (c) Explain how Louis Edgar could use the analysis to inform decision making. You can assume the data follows a normal distribution. You are not required to perform any calculations for this task.
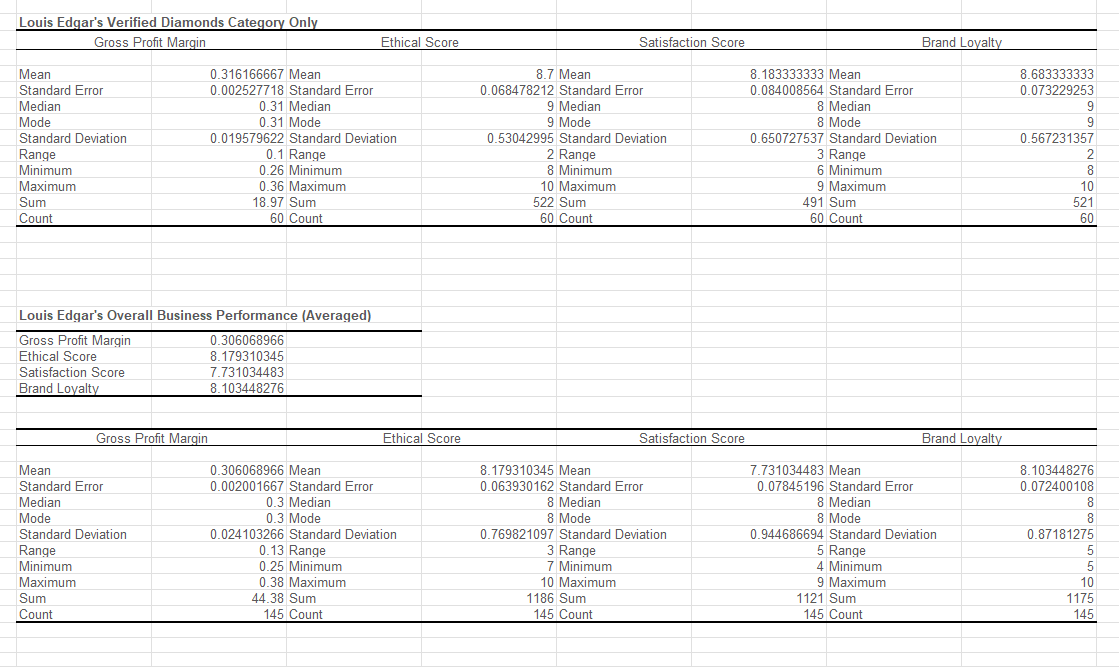
F-Test Two-Sample for Variances - Ethical Scores \begin{tabular}{|l|r|r|} \hline & Unverified Diamonds & Verified Diamonds \\ \hline Mean & 7.811764706 & 8.7 \\ \hline Variance & 0.487955182 & 0.281355932 \\ \hline Observations & 85 & 60 \\ \hline df & 84 & 59 \\ \hline F & 1.734298539 & \\ \hline P (F variance of variable 2 , which is the case 0.49>0.28. Otherwise, variables must be swapped. F >F Critical one-tail (1.73>1.50); hence, Variances are not equal and t-test for unequal variances should be used. t-Test: Two-Sample Assuming Unequal Variances - Ethical Scores \begin{tabular}{|l|r|r|} \hline & Unverified Diamonds & Verified Diamonds \\ \hline Mean & 7.811764706 & 8.7 \\ \hline Variance & 0.487955182 & 0.281355932 \\ \hline Observations & 85 & 60 \\ \hline Hypothesized Mean Difference & 0 & \\ \hline df & 142 & \\ \hline t Stat & -8.697364008 & \\ \hline P (T
Step by Step Solution
There are 3 Steps involved in it
Step: 1

Get Instant Access to Expert-Tailored Solutions
See step-by-step solutions with expert insights and AI powered tools for academic success
Step: 2

Step: 3

Ace Your Homework with AI
Get the answers you need in no time with our AI-driven, step-by-step assistance
Get Started


