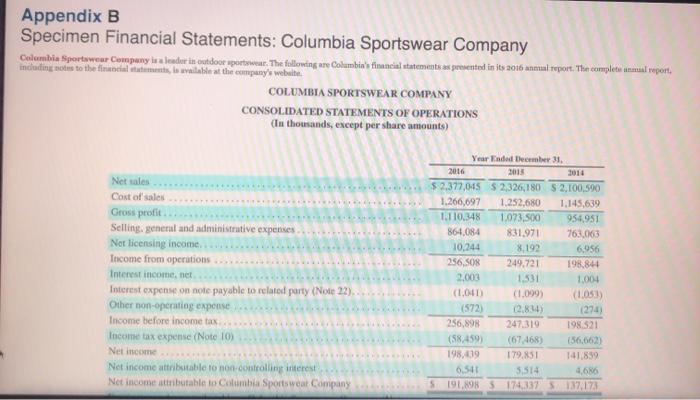
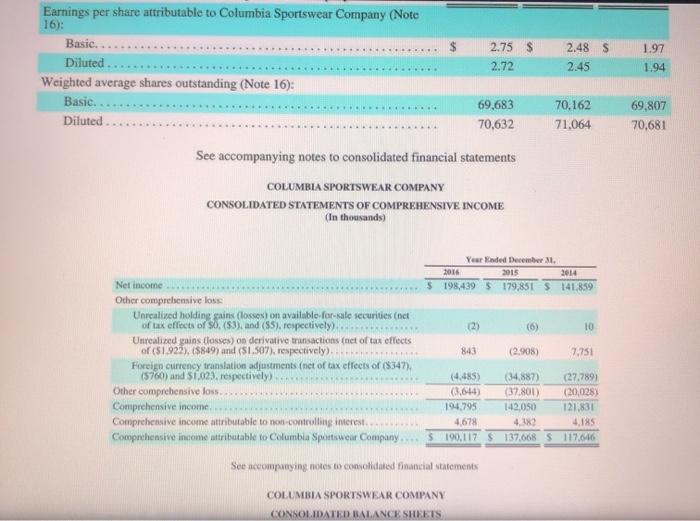
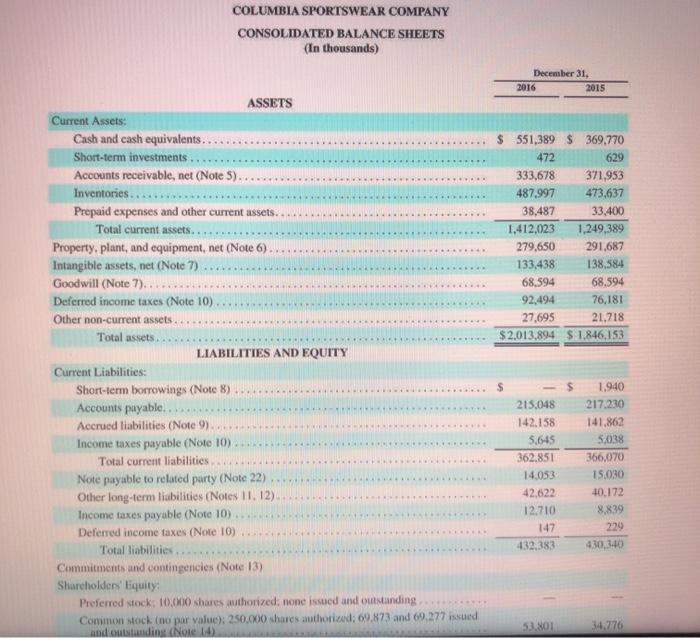
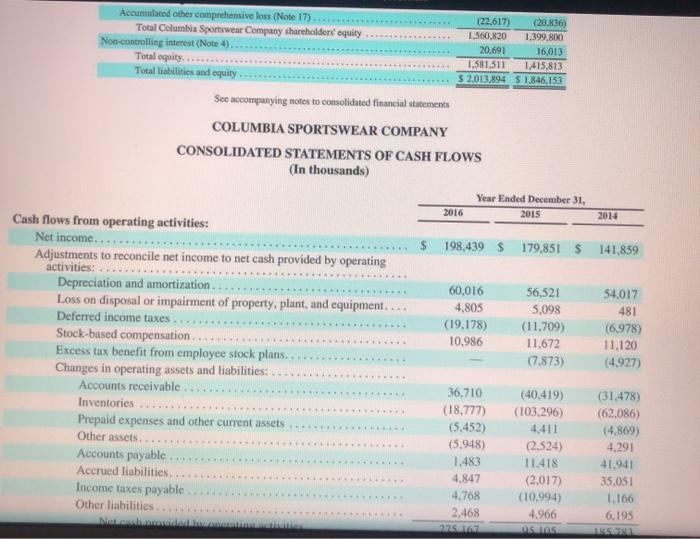
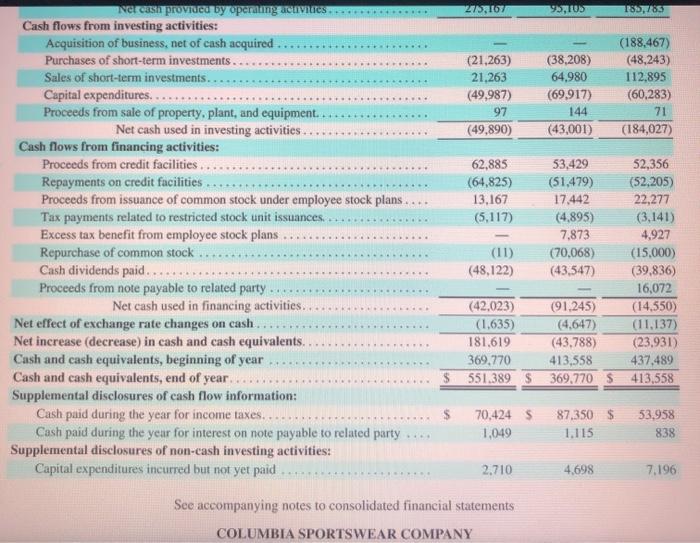
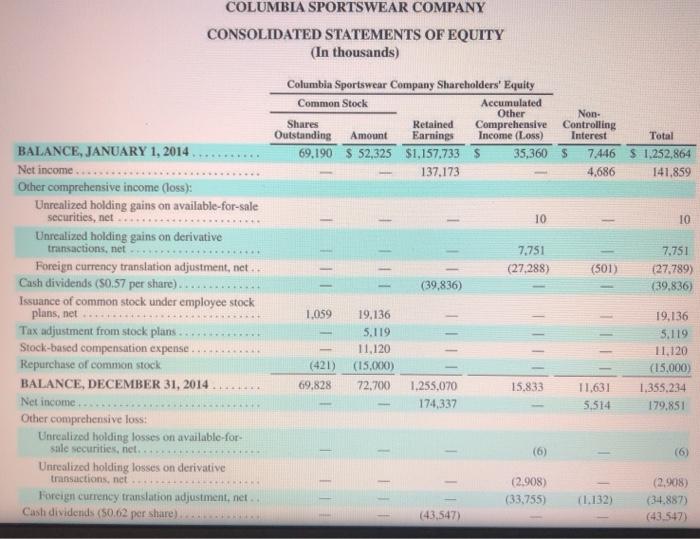
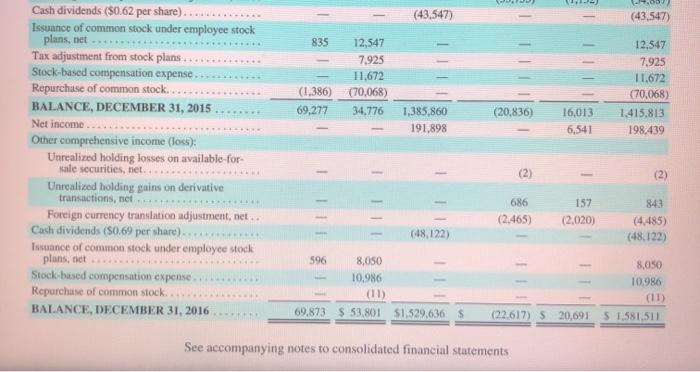
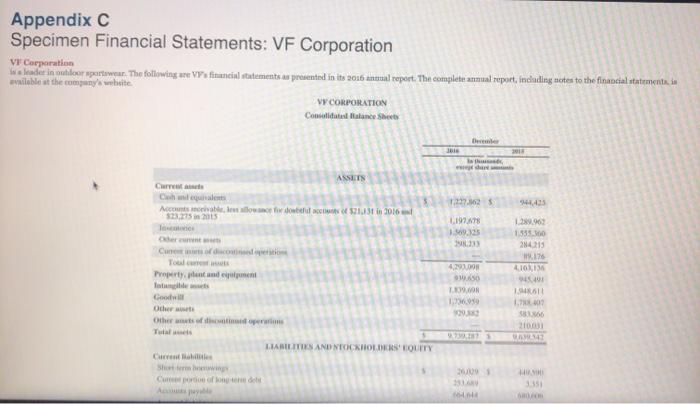
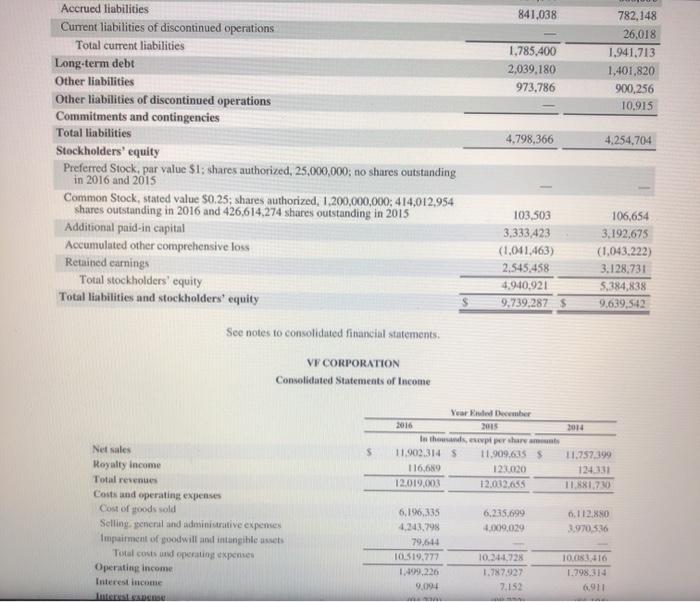
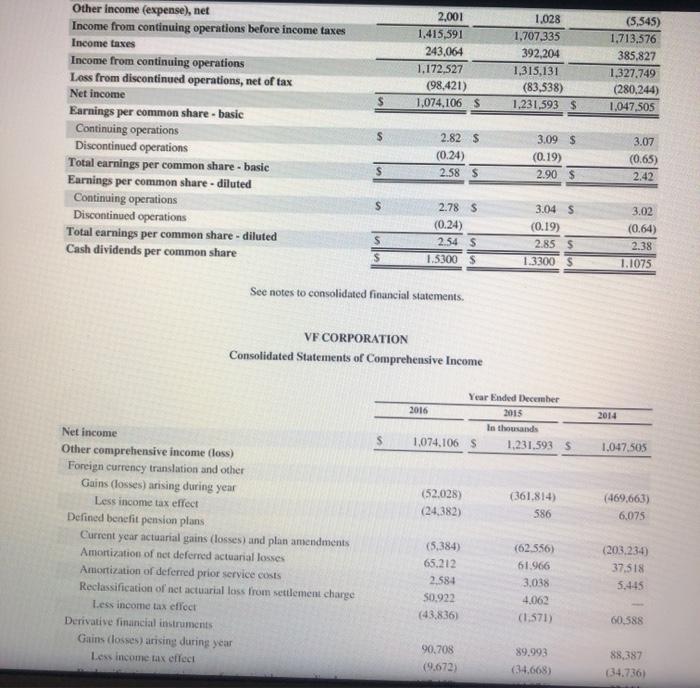
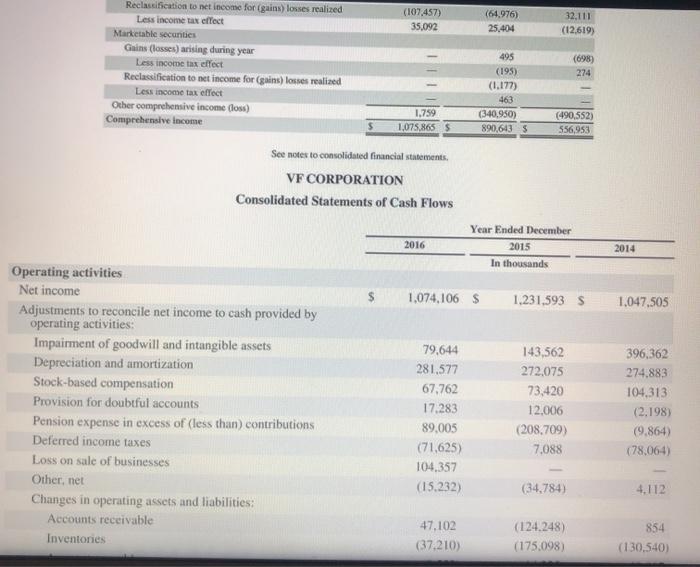
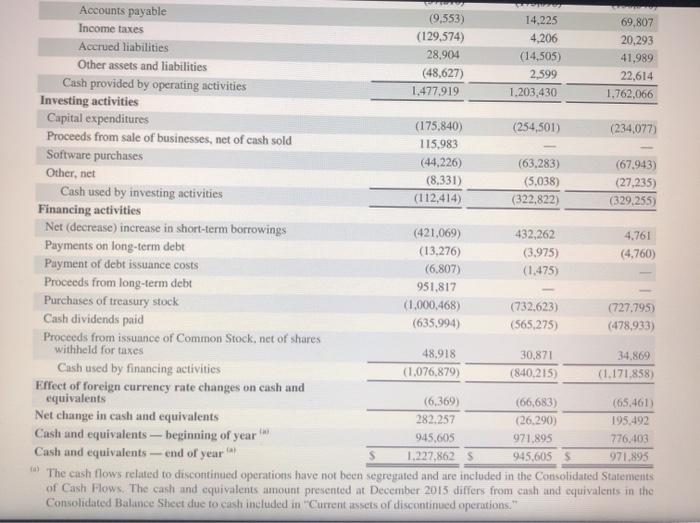
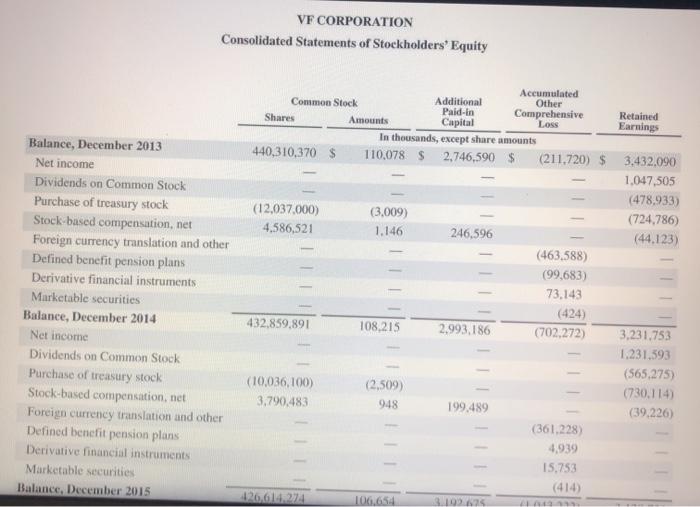
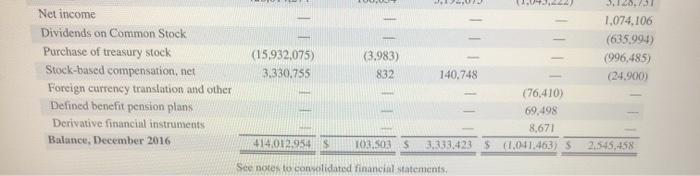
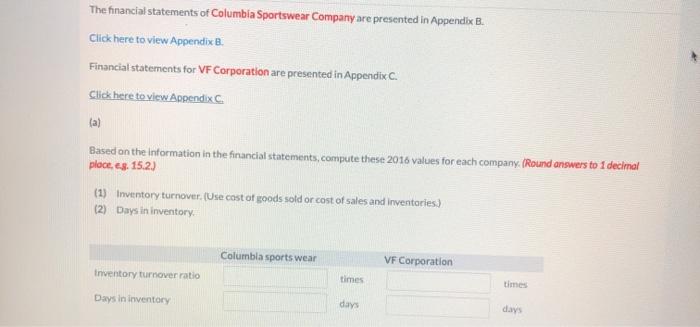
Appendix B Specimen Financial Statements: Columbia Sportswear Company Columbia Sportswear Company is a leader in outdoor sportswear. The following are Columbia's financial statements as peresented in its 2016 annual report. The complete inmul teport including notes to the financial statement, la wilable at the company's webat COLUMBIA SPORTSWEAR COMPANY CONSOLIDATED STATEMENTS OF OPERATIONS (In thousands, except per share amounts) Net sales Cost of sales Gross profit Selling general and administrative expenses Not licensing income Income from operations Interest income, net Interest expense on note payable to related party (No 22). Other non-operating expense Income before income tax Income tax expense (Note 10) Net in Net income attributable to non-controlling interest Net income attributable to Columbia Sportsweat Company Year Ended December 31 2016 $ 2.377,045 S 2,326,180 S 2,100.590 1.266,097 1.252.680 1.145,639 1.110,348 1.073,500 954.951 864.084 831.971 763,063 10.244 8,192 6,956 256,508 249.721 198.844 2003 1331 1.004 (1,041 (1,099) (1.053) (572) 2,844) (274) 256,898 247.319 198.521 (58.459) (67.468) 156,662) 198,419 179.851 141.859 6.541 5.514 4,686 S 191,898 $ 174.137 137,173 Earnings per share attributable to Columbia Sportswear Company (Note 16): Basic. Diluted.. Weighted average shares outstanding (Note 16): Basic. Diluted 2.75 $ 2.72 2.48 $ 2.45 1.97 1.94 69,683 70,632 70.162 71,064 69,807 70,681 See accompanying notes to consolidated financial statements COLUMBIA SPORTSWEAR COMPANY CONSOLIDATED STATEMENTS OF COMPREHENSIVE INCOME (In thousands) Yearded December 31 2016 2015 2014 $ 198,439 $179,851 5141.859 (2) 10 843 (2.908) 7.751 Net income Other comprehensive loss Unrealised holding sains (losses) on available-for-sale securities (net of tax effects of $0, (53), and (55), respectively) Unrealized gains classes) on derivative transactions (net of tax effects of ($1.922), (5849) and (51.907), respectively), Foreign currency translation adjustments (set of tax effects of ($347), (5760) and 51.023, respectively) Other comprehensive loss Comprehensive income Comprehensive income attributable to non controlling interest Comprehensive income attributable to Columbia Sportswear Company 4.485) (3.644) 194,795 4.678 190,117 (34.887) (27.789) (37.801) (20.028) 142.050 121,831 4.182 4.185 137.668 S 117.646 See accompanying notes to consolidated financial statements COLUMBIA SPORTSWEAR COMPANY CONSOLIDATED BALANCE SHEETS COLUMBIA SPORTSWEAR COMPANY CONSOLIDATED BALANCE SHEETS (In thousands) December 31, 2016 2015 551,389 $ 369.770 472 629 333,678 371,953 487,997 473.637 38,487 33.400 1,412,023 1,249,389 279,650 291,687 133,438 138,584 68,594 68,594 92,494 76,181 27,695 21,718 $2.013.894 $ 1.846,153 ASSETS Current Assets: Cash and cash equivalents..... Short-term investments Accounts receivable, net (Note 5). Inventories... Prepaid expenses and other current assets. Total current assets.. Property, plant, and equipment, net (Note 6) Intangible assets, net (Note 7) Goodwill (Note 7)........ Deferred income taxes (Note 10). Other non-current assets. Total assets LIABILITIES AND EQUITY Current Liabilities: Short-term borrowings (Note 8) Accounts payable. Accrued liabilities (Note 9) Income taxes payable (Note 10) Total current liabilities Note payable to related party (Note 22) Other long-term liabilities (Notes 11.12) Income taxes payable (Note 10) Deferred income taxes (Note 10) Total liabilities Commitments and contingencies (Note 13) Shareholders' Equity Preferred stock: 10,000 shares authorized: none issued and outstanding Common stock no par value): 250.000 shares authorized: 69.873 and 69.277 issued and outstanding (Note 4) 215.048 142.158 5,645 362.851 14.053 42.622 12.710 142 432,383 1.940 217.230 141,862 5,038 366,070 15.030 40.172 8,839 229 430,340 53.80 34,776 Accumulated other comprehensive loss (Note 17) (22,617) (20,836 Total Columbia Sportswear Company shareholders' equity 1.560.820 1.399,800 Non-controlling interest (Note 4) 20,691 16,013 Total equity. 1.581.511 1.415,813 Total liabilities and equity $ 2,013,894 $ 1.846,153 See accompanying notes to consolidated financial statements COLUMBIA SPORTSWEAR COMPANY CONSOLIDATED STATEMENTS OF CASH FLOWS (In thousands) Year Ended December 31, 2015 2016 2014 $ 198,439 $ 179,851 $ 141.859 60,016 4.805 (19,178) 10,986 Cash flows from operating activities: Net income. Adjustments to reconcile net income to net cash provided by operating activities: Depreciation and amortization Loss on disposal or impairment of property, plant, and equipment. Deferred income taxes Stock-based compensation Excess tax benefit from employee stock plans.. Changes in operating assets and liabilities: Accounts receivable Inventories Prepaid expenses and other current assets Other assets Accounts payable Accrued liabilities Income taxes payable Other liabilities Naoshidah 56,521 5,098 (11.709) 11.672 (7.873) 54,017 481 (6,978) 11.120 (4.927) 36,710 (18.777) (5,452) (5.948) 1.483 4.847 4.768 2,468 (40,419) (103,296) 4,411 (2.524) 11.418 (2,017) (10,994) 4,966 OSTS (31,478) (62,086) (4.869) 4.291 41.941 35,051 1.166 6,195 2957107 95,US 1857765 (21,263) 21,263 (49,987) 97 (49,890) (38,208) 64,980 (69.917) 144 (43,001) (188.467) (48,243) 112,895 (60,283) 71 (184,027) Nesaprovucu by operumg envie Cash flows from investing activities: Acquisition of business, net of cash acquired Purchases of short-term investments.. Sales of short-term investments.... Capital expenditures..... Proceeds from sale of property, plant, and equipment.. Net cash used in investing activities. Cash flows from financing activities: Proceeds from credit facilities Repayments on credit facilities Proceeds from issuance of common stock under employee stock plans. Tax payments related to restricted stock unit issuances. Excess tax benefit from employee stock plans Repurchase of common stock Cash dividends paid. Proceeds from note payable to related party Net cash used in financing activities. Net effect of exchange rate changes on cash... Net increase (decrease) in cash and cash equivalents. Cash and cash equivalents, beginning of year Cash and cash equivalents, end of year. Supplemental disclosures of cash flow information: Cash paid during the year for income taxes.. Cash paid during the year for interest on note payable to related party Supplemental disclosures of non-cash investing activities: Capital expenditures incurred but not yet paid 62,885 53,429 52,356 (64,825) (51,479) (52,205) 13,167 17.442 22,277 (5,117) (4,895) (3,141) 7.873 4,927 (11) (70,068) (15,000) (48,122) (43,547) (39,836) 16,072 (42.023) (91.245) (14.550) (1.635) (4,647) (11.137) 181.619 (43.788) (23,931) 369,770 413,558 437.489 $ 551.389 $ 369,770 $ 413,558 70,424 $ 1,049 87,350 $ 1.115 53,958 838 2,710 4.698 7.196 See accompanying notes to consolidated financial statements COLUMBIA SPORTSWEAR COMPANY COLUMBIA SPORTSWEAR COMPANY CONSOLIDATED STATEMENTS OF EQUITY (In thousands) Columbia Sportswear Company Shareholders' Equity Common Stock Accumulated Other Non- Shares Retained Comprehensive Controlling Outstanding Amount Earnings Income (Loss) Interest Total BALANCE, JANUARY 1, 2014 69,190 $ 52,325 $1,157.733 $ 35,360 $ 7,446 $ 1.252,864 Net income 137.173 4,686 141.859 Other comprehensive income (loss): Unrealized holding gains on available-for-sale securities, net 10 10 Unrealized holding gains on derivative transactions, net 7,751 7.751 Foreign currency translation adjustment, net... (27,288) (501) (27,789) Cash dividends (50.57 per share)... (39,836) (39.836) Issuance of common stock under employee stock plans, net 1.059 19,136 19,136 Tax adjustment from stock plans. 5.119 5.119 Stock-based compensation expense 11,120 11.120 Repurchase of common stock (421 (15,000) (15.000 BALANCE, DECEMBER 31, 2014 69.828 72,700 1.255.070 15.833 11.631 1.355,234 Net income 174,337 5.514 179,851 Other comprehensive loss: Unrealized holding losses on available-for- sale securities, nel (6) Unrealized holding losses on derivative transactions, net (2.908) (2,908) Foreign currency translation adjustment, net (33,755) (1.132) (34.887) Cash dividends (50.62 per share) (43,547) 43:547) 119 LLL (43,547) (43,547) 835 12,547 7.925 11,672 (1.386) (70,068) 69,277 34,776 12,547 7.925 11,672 (70,068) 1.415.813 198.439 (20,836) 1,385,860 191,898 16,013 6,541 - Cash dividends (50.62 per share). Issuance of common stock under employee stock plans, net Tax adjustment from stock plans Stock-based compensation expense Repurchase of common stock. BALANCE, DECEMBER 31, 2015 Net income Other comprehensive income (loss): Unrealized holding losses on available for sale securities, niet Unrealized holding gains on derivative transactions, net Foreign currency translation adjustment, net Cash dividends (50.69 per share) Issuance of common stock under employee stock plans, net Stock-based compensation expense Repurchase of common stock BALANCE, DECEMBER 31, 2016 1 (2) (2) 1 686 (2.465) 157 (2,020) 843 (4.485) (48,122) (48,122) 596 8,050 10.986 (11) 8,050 10.986 (11) S 1.581.511 69,873 $ 53,801 $1,529,636 $ (22.617) S 20.691 See accompanying notes to consolidated financial statements Appendix C Specimen Financial Statements: VF Corporation Weleder in dahilor sportswear. The following are V. financial statements es presented in its 2016 antal report. The complete annual report, including notes to the financial statementale VY CORPORATION Concilitated Balance Sheet V Corporation ilable at the company white 2013 ta ASSETS Cih S350 www do 01.131 2016 1.1978 19.125 1.335.000 214215 176 41011 Property and ment 4.292.00 50 .. 1.730.09 70 Cool Other Othernofedoper 2003 LIABILITIES AND NOCKHOLDERS' EQUITY Cuba She 09 841,038 1.785.400 2,039,180 973.786 782,148 26,018 1.941,713 1,401,820 900,256 10,915 4,798,366 4.254,704 Accrued liabilities Current liabilities of discontinued operations Total current liabilities Long-term debt Other liabilities Other liabilities of discontinued operations Commitments and contingencies Total liabilities Stockholders' equity Preferred Stock, par value $1; shares authorized, 25,000,000; no shares outstanding in 2016 and 2015 Common Stock, stated value $0.25; shares authorized, 1.200,000,000; 414,012954 shares outstanding in 2016 and 426,614,274 shares outstanding in 2015 Additional paid-in capital Accumulated other comprehensive loss Retained carnings Total stockholders' equity Total liabilities and stockholders' equity 103,503 3,333 423 (1.041.463) 2.545,458 4,940,921 9.739,287 106,654 3.192,675 (1.043.222) 3.128,731 5.384,838 9,639,542 See notes to consolidated financial statements, VF CORPORATION Consolidated Statements of Income 2014 5 Year End December 2016 2015 In the explorare 11.902.314 5 11.909.625$ 116,689 121620 12.019.003 12.032,655 11.757.399 11.881.730 Net sales Royalty Income Total revenues Costs and operating expenses Cost of goods sold Selling penent and administrative expenses Impairment of poodwill and intangible assets Total costs and operating experts Operating income Interest income InterSLEDGE 6,235,699 4.009.029 0,112.880 3.970,536 6,196,333 4.343.799 79.644 TO519,777 1.499.226 9.091 10.344,728 1.787927 2.152 10.08.16 1.798,314 6,911 2.001 1,415,591 243,064 1,172,527 (98,421) 1,074,106 $ 1,028 1,707,335 392,204 1,315,131 (83,538) 1,231,593 $ (5,545) 1,713,576 385.827 1.327.749 (280.244) 1.047,505 Other income (expense), net Income from continuing operations before income taxes Income taxes Income from continuing operations Loss from discontinued operations, net of tax Net income Earnings per common share - basic Continuing operations Discontinued operations Total earnings per common share - basic Earnings per common share - diluted Continuing operations Discontinued operations Total earnings per common share - diluted Cash dividends per common share 2.82 $ (0.24) 2.58 $ 3.09 $ (0.19) 2.90 $ 3.07 (0.65) 2.42 2.78 $ (0.24) 2.54s 1.5300 $ 3.04 S (0.19) 2.85$ 1.3300 S s $ 3.02 (0.64) 2.38 1.1075 See notes to consolidated financial statements. VF CORPORATION Consolidated Statements of Comprehensive Income Year Ended December 2016 2015 In thousands 1,074,106 S 1.231.593 5 2014 $ 1.047.505 (52.028) (24.382) (361.814) 586 (469,663) 6,075 Net income Other comprehensive income Class) Foreign currency translation and other Gains (losses) arising during year Less income tax effect Defined benefit pension plans Current year actuarial gains (losses) and plan amendments Amortization of net deferred actuarial losses Amortization of deferred prior service costs Reclassification of net actuarial loss from settlement charge Less income tax effect Derivative financial instruments Gains classes) arising during year Less income tax effect (5.384) 65,212 2.584 $0.922 (43.836) (62.556) 61.966 3,038 4,062 (1.571) (203.234) 37,518 5.445 60.588 90,708 (9.672) 89.993 (34.668) 88,387 (34.736) (107,457) 35,092 (64.976) 25,404 32.111 (12.619) (698) Reclassification to net income for (gains) losses realized Less income tax effect Marketable secunties Gains (losses) arising during year Less income tax effect Reclassification to net income for (gains) losses realised Less income tax effect Other comprehemive income (los) Comprehensive Income III 274 495 (195) (1.177) 463 (340,950) 890,6435 1.759 1,075,865 S (490.552) 556,953 See notes to consolidated financial statements. VF CORPORATION Consolidated Statements of Cash Flows 2016 Year Ended December 2015 In thousands 2014 1,074,106 $ 1.231,593 1.047.505 Operating activities Net income Adjustments to reconcile net income to cash provided by operating activities: Impairment of goodwill and intangible assets Depreciation and amortization Stock-based compensation Provision for doubtful accounts Pension expense in excess of (less than) contributions Deferred income taxes Loss on sale of businesses Other, net Changes in operating assets and liabilities: Accounts receivable Inventories 79.644 281.577 67,762 17.283 89,005 (71.625) 104,357 (15.232) 143,562 272,075 73,420 12,006 (208.709) 7.088 396,362 274.883 104,313 (2.198) (9.864) (78,064) (34,784) 4.112 854 47.102 (37.210) (124.248) (175.098) (130,540) Accounts payable (9,553) 14,225 69,807 Income taxes (129,574) 4,206 20,293 Accrued liabilities 28,904 (14,505 41.989 Other assets and liabilities (48,627) 2,599 22.614 Cash provided by operating activities 1,477.919 1.203,430 1.762,066 Investing activities Capital expenditures (175.840) (254,501) (234,077) Proceeds from sale of businesses, net of cash sold 115,983 Software purchases (44.226) (63.283) (67.943) Other, net (8,331) (5,038) (27,235) Cash used by investing activities (112,414) (322,822) (329.255) Financing activities Net (decrease) increase in short-term borrowings (421,069) 432,262 4,761 Payments on long-term debt (13,276) (3.975) (4,760) Payment of debt issuance costs (6,807) (1,475) Proceeds from long-term debt 951,817 Purchases of treasury stock (1.000.468) (732,623) (727.795) Cash dividends paid (635,994) (565,275) (478,933) Proceeds from issuance of Common Stock, net of shares withheld for taxes 48,918 30.871 34.869 Cash used by financing activities (1,076,879) (840,215) (1.171,858) Effect of foreign currency rate changes on cash and equivalents (6,369) (66,683) (65.461) Net change in cash and equivalents 282.257 (26.290) 195,492 Cash and equivalents -- beginning of year 945,605 971.895 776,403 Cash and equivalents -- end of year 1.227,8625 945,605 971.895 The cash flows related to discontinued operations have not been segregated and are included in the Consolidated Statements of Cash Flows. The cash and equivalents amount presented at December 2015 differs from cash and equivalents in the Consolidated Balance Sheet due to cash included in "Current assets of discontinued operations." VF CORPORATION Consolidated Statements of Stockholders' Equity Balance, December 2013 Net income Dividends on Common Stock Purchase of treasury stock Stock-based compensation, net Foreign currency translation and other Defined benefit pension plans Derivative financial instruments Marketable securities Balance, December 2014 Net income Dividends on Common Stock Purchase of treasury stock Stock-based compensation, net Foreign currency translation and other Defined benefit pension plans Derivative financial instruments Marketable securities Balance, December 2015 Accumulated Common Stock Additional Other Paid-in Comprehensive Retained Shares Amounts Capital Loss Earnings In thousands, except share amounts 440,310,370 $ 110,078 S 2,746,590 $ (211.720) $ 3,432,090 1,047,505 (478,933) (12,037.000) (3,009) (724,786) 4,586,521 1.146 246,596 (44,123) (463,588) (99,683) 73.143 (424) 432.859,891 108.215 2,993,186 (702,272) 3,231.753 1.231.593 (565,275) (10,036,100) (2,509) (730,114) 3,790,483 948 199.489 (39.226) (361,228) 4,939 15.753 (414) 126,014,274 106,654 3.1995 Net income Dividends on Common Stock Purchase of treasury stock Stock-based compensation, net Foreign currency translation and other Defined benefit pension plans Derivative financial instruments Balance, December 2016 2120, 1,074,106 (635,994) (996,485) (24.900) (15.932,075) 3.330.755 (3,983) 832 140.748 (76,410) 69,198 8,671 3,333,423 $1.041.463) S 414.012.954 103.5035 2.545,458 See notes to consolidated financial statements. The financial statements of Columbia Sportswear Company are presented in Appendix B. Click here to view Appendix 2. Financial statements for VF Corporation are presented in Appendix C Click here to view Appendix Based on the Information in the financial statements, compute these 2016 values for each company. (Round answers to 1 decimal place, 63. 15.2) (1) Inventory turnover (Use cost of goods sold or cost of sales and inventaries) (2) Days in inventory Columbia Sportswear VF Corporation Inventory turnover ratio times times Days in inventory days days