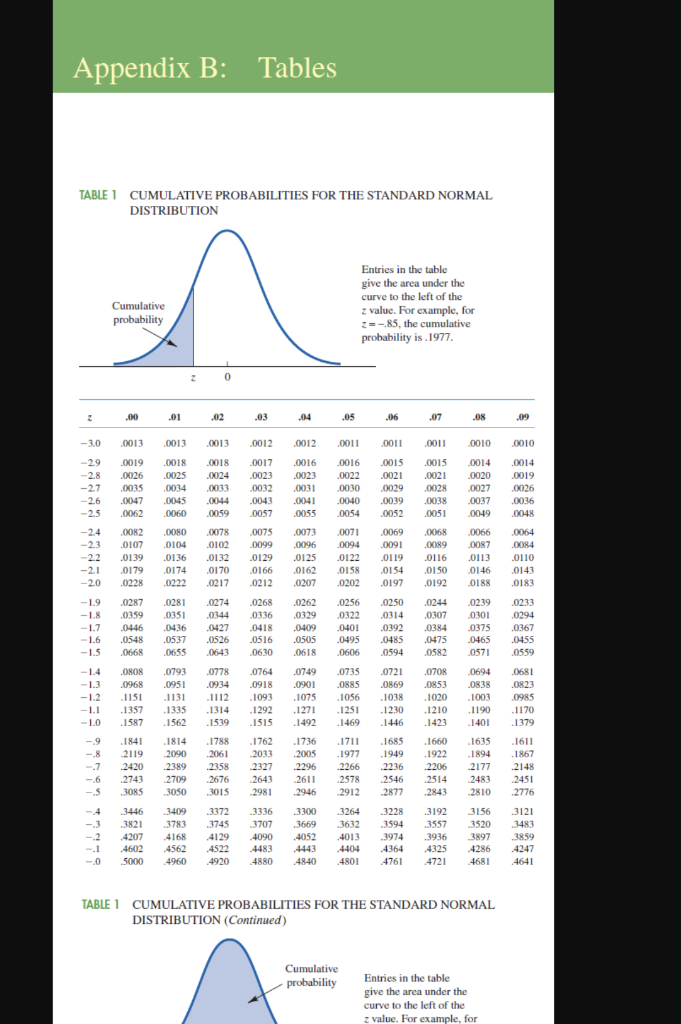
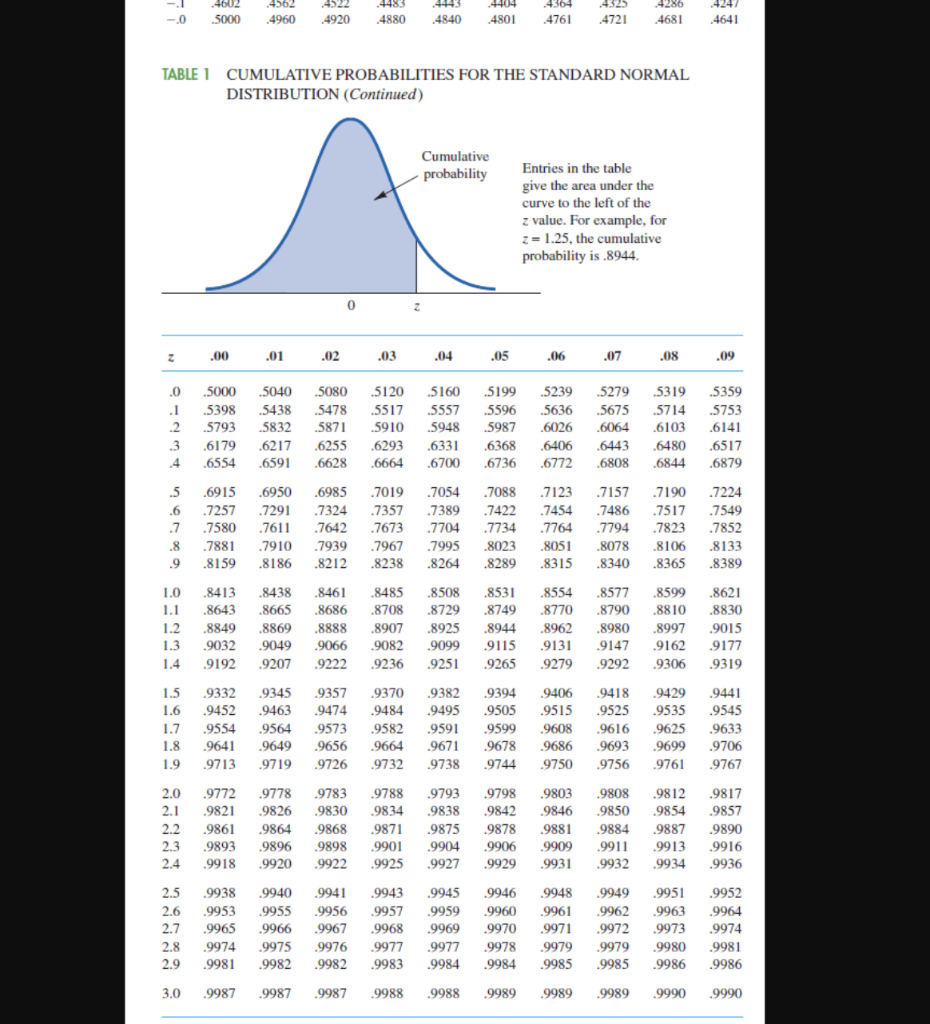
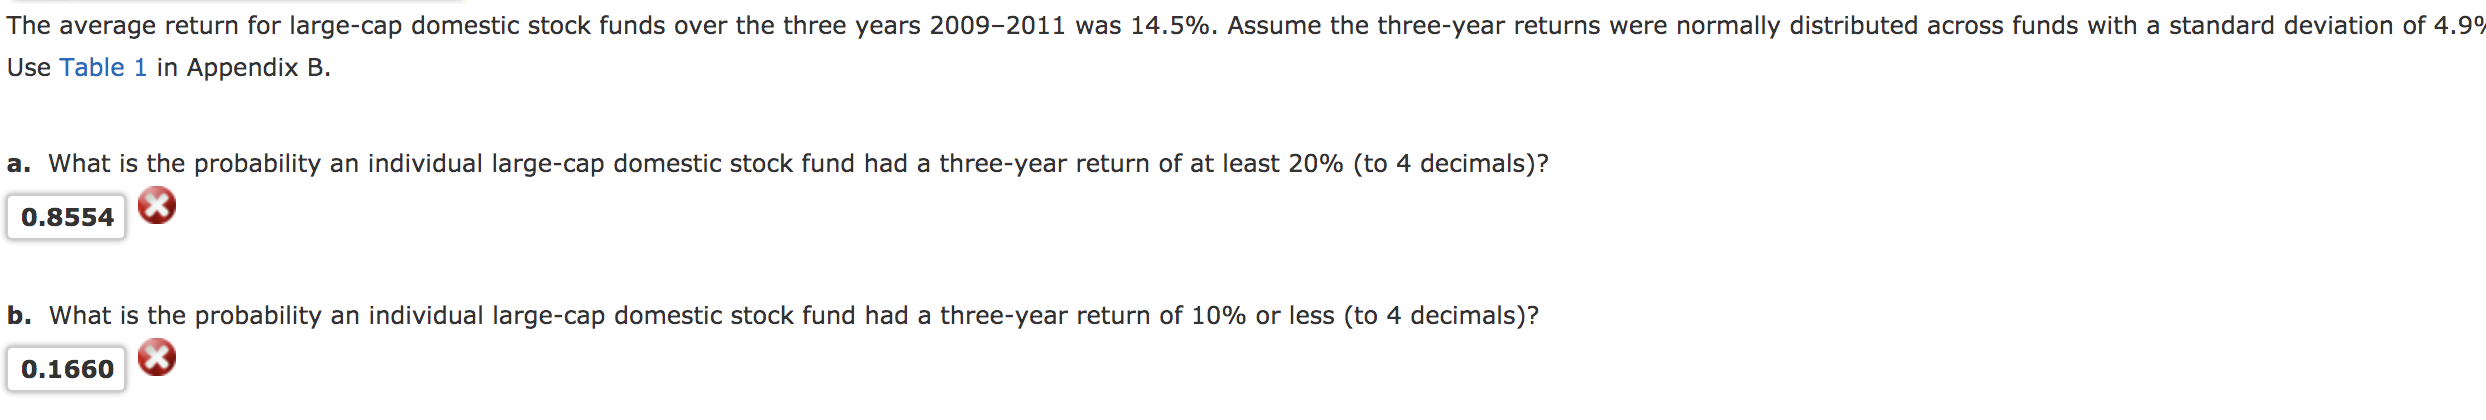
Appendix B: Tables TABLE 1 CUMULATIVE PROBABILITIES FOR THE STANDARD NORMAL DISTRIBUTION Entries in the table give the area under the curve to the left of the z value. For example, for z85, the cumulative bilit probability is 0 02 03 040s 01 0013 0013 0012 0012 00 001 0019 00180018 0017 00160016 00150015 0014 3.0 .0035 .0034 0033 0032 0031 0030 0029 0047 0045 044 0043 004 TABLE 1 CUMULATIVE PROBABILITIES FOR THE STANDARD NORMAL DISTRIBUTION (Continued) 4602 4562 4522 4483 4443 4404 4364 4325 4286 4247 5000 4960 4920 4880 4721 4641 .0 4840 4801 4761 4681 TABLE 1 CUMULATIVE PROBABILITIES FOR THE STANDARD NORMAL DISTRIBUTION (Continued) Cumulative Entries in the table probability give the area under the curve to the left of the z value. For example, for z=1.25, the cumulative probability is.8944. 00 01 .02 03 04 05 06 07 08 .09 5000 5040 5080 5120 5160 .5199 5239 5279 5319 5359 5438 5517 .5398 .5478 5557 .5596 5636 5675 5714 5753 2 5793 5948 5987 614 5832 5871 5910 .6026 6064 6103 6293 3 .6179 .6217 6255 .6331 6368 .6406 .6443 .6517 6480 6772 4 6554 6591 6628 6664 6700 6736 .6808 6844 .6879 6950 7054 7123 7190 .5 .6915 6985 7019 7088 7157 7224 7257 7291 7324 7357 7389 7422 7454 7486 7517 7549 .6 7734 77580 7611 7642 7673 7704 7764 7794 7823 7852 7995 8264 8023 8289 7939 7967 8 7881 7910 8051 8078 8106 8133 8159 8186 8212 8238 8315 8340 8365 8389 .9 10 8413 8438 8461 8485 8508 8531 8554 8577 8599 8621 8665 .8729 1.1 8643 8686 8708 8749 8770 8790 8810 8830 8925 .8980 9147 1.2 8849 .8869 8888 8907 8944 8962 8997 9015 9032 13 9049 .9066 9082 .9099 .9115 .9131 9162 9177 1.4 9192 9319 9207 9222 9236 9251 9265 9279 9292 9306 9332 9345 9357 9406 9418 1.5 9370 .9382 9394 9429 9441 1.6 .9452 .9463 .9474 9484 9495 9505 9515 .9525 .9535 9545 1.7 .9554 9564 9573 9582 9599 .9608 9616 9625 9633 .9591 9671 9699 9706 1.8 9641 9649 9656 9664 9678 9686 9693 9713 9767 1.9 9719 9726 9732 9738 .9744 9750 9756 9761 2.0.9772 .9783 9778 9788 9793 9798 9803 9808 9812 9817 9826 9830 9834 9846 9850 9854 9857 2.1 9821 9838 9842 9881 9909 2.2 9861 9875 9904 .9878 9884 9887 9864 .9868 9871 9890 2.3 9893 9896 9898 9901 9906 9911 9913 9916 2.4 9918 9922 9925 .9927 9929 9931 9932 .9934 9936 9920 9938 9943 9945 .9949 .9951 9952 2.5 9940 9941 9946 9948 9960 9961 9959 2.6 9953 .9955 .9956.9957 9962 .9963 .9964 2.7 .9965 9966 .9967 9971 9972 .9973 9968 .9969 9970 .9974 .9979 9981 2.8 9974 9975 .9976 9977 9977 9978 .9979 .9980 9982 9986 2.9 .9981 9982 9983 .9984 9984 9985 9985 9986 9987 3.0 9987 9987 9988 .9988 9989 9989 9989 9990 9990 The average return for large-cap domestic stock funds over the three years 2009-2011 was 14.5%. Assume the three-year returns were normally distributed across funds with a standard deviation of 4.9% Use Table 1 in Appendix B. a. What is the probability an individual large-cap domestic stock fund had a three-year return of at least 20% (to 4 decimals)? 0.8554 b. What is the probability an individual large-cap domestic stock fund had a three-year return of 10% or less (to 4 decimals)? 0.1660