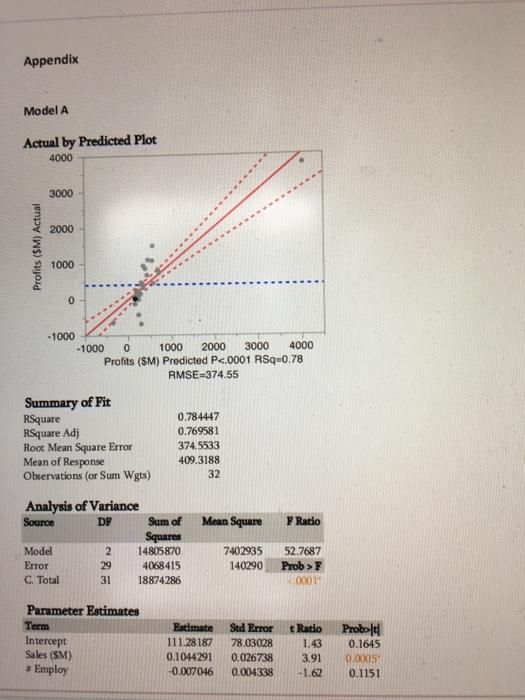
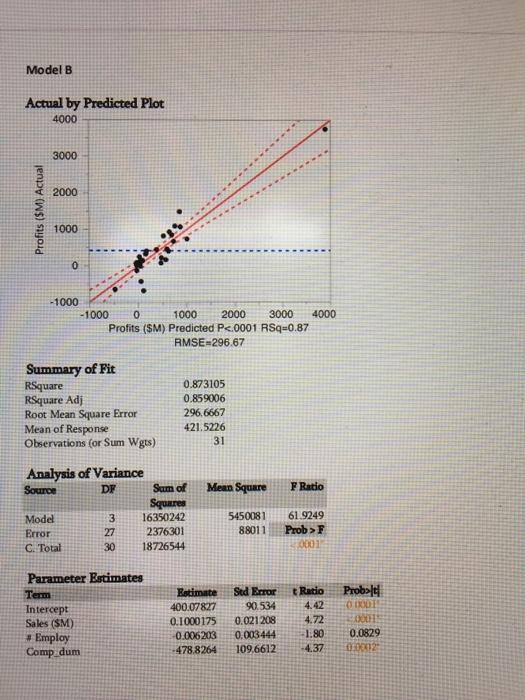
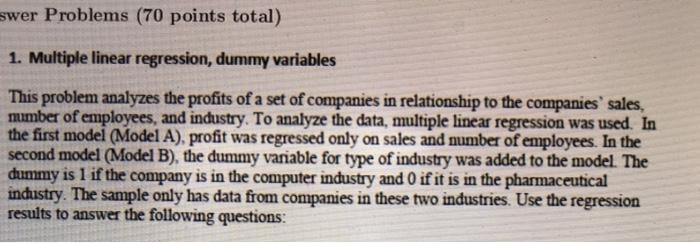
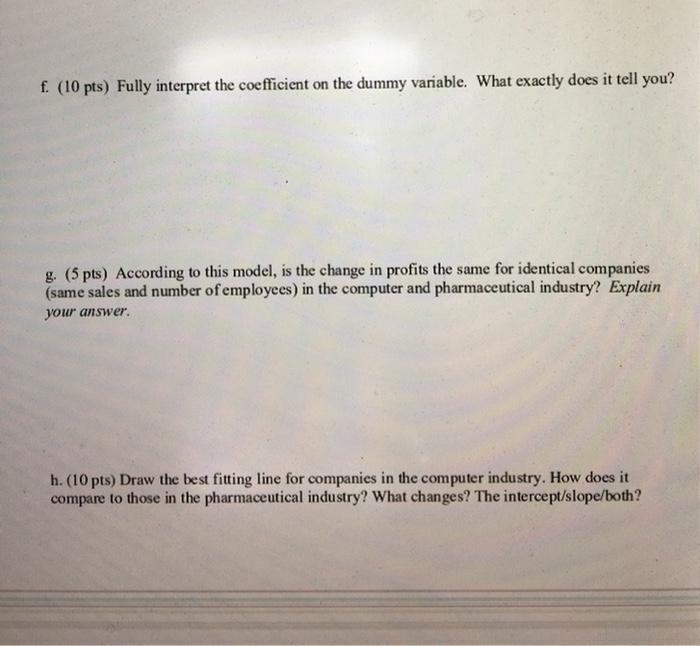
Appendix Model A Actual by Predicted Plot 4000 3000 2000 Profits (SM) Actual 1000 0 -1000 -1000 0 1000 2000 3000 4000 Profits ($M) Predicted P<.0001 rsq="0.78" rmse-374.55 summary of fit rsquare adi root mean square error response observations sum wgts radio analysis variance source df model c. total prob> F 2.0001 Parameter Estimates Term Intercept Sales (SM) Employ Estimate 111.28187 0.1044291 -0.007046 Sud Error 78.03028 0.026738 0.004338 tRatio 43 3.91 -1.62 Proble 0.1645 0.00051 0.1151 Model B Actual by Predicted Plot 4000 3000 2000 Profits ($M). Actual 1000 0 -1000 -1000 0 1000 2000 3000 4000 Profits ($M) Predicted P<.0001 rsq="0.87" rmse="296.67" summary of fit rsquare adj root mean square error response observations sum wgts f ratio analysis variance source df squares model c. total prob>F 0001 Probolt ODE Parameter Estimates Term Intercept Sales (SM) # Employ Comp_dum Estimate 400.07827 0.1000175 0.006203 -478.8264 Sed Error 90.534 0.021 208 0.003444 109.6612 tRatio 4.42 4.72 -1.80 -4.37 0.0829 08032 swer Problems (70 points total) 1. Multiple linear regression, dummy variables This problem analyzes the profits of a set of companies in relationship to the companies' sales, mmber of employees, and industry. To analyze the data, multiple linear regression was used. In the first model (Model A), profit was regressed only on sales and number of employees. In the second model (Model B), the dummy variable for type of industry was added to the model. The dummy is 1 if the company is in the computer industry and 0 if it is in the pharmaceutical industry. The sample only has data from companies in these two industries. Use the regression results to answer the following questions: f. (10 pts) Fully interpret the coefficient on the dummy variable. What exactly does it tell you? g. (5 pts) According to this model, is the change in profits the same for identical companies (same sales and number of employees) in the computer and pharmaceutical industry? Explain your answer. h. (10 pts) Draw the best fitting line for companies in the computer industry. How does it compare to those in the pharmaceutical industry? What changes? The intercept/slope/both? Appendix Model A Actual by Predicted Plot 4000 3000 2000 Profits (SM) Actual 1000 0 -1000 -1000 0 1000 2000 3000 4000 Profits ($M) Predicted P<.0001 rsq="0.78" rmse-374.55 summary of fit rsquare adi root mean square error response observations sum wgts radio analysis variance source df model c. total prob> F 2.0001 Parameter Estimates Term Intercept Sales (SM) Employ Estimate 111.28187 0.1044291 -0.007046 Sud Error 78.03028 0.026738 0.004338 tRatio 43 3.91 -1.62 Proble 0.1645 0.00051 0.1151 Model B Actual by Predicted Plot 4000 3000 2000 Profits ($M). Actual 1000 0 -1000 -1000 0 1000 2000 3000 4000 Profits ($M) Predicted P<.0001 rsq="0.87" rmse="296.67" summary of fit rsquare adj root mean square error response observations sum wgts f ratio analysis variance source df squares model c. total prob>F 0001 Probolt ODE Parameter Estimates Term Intercept Sales (SM) # Employ Comp_dum Estimate 400.07827 0.1000175 0.006203 -478.8264 Sed Error 90.534 0.021 208 0.003444 109.6612 tRatio 4.42 4.72 -1.80 -4.37 0.0829 08032 swer Problems (70 points total) 1. Multiple linear regression, dummy variables This problem analyzes the profits of a set of companies in relationship to the companies' sales, mmber of employees, and industry. To analyze the data, multiple linear regression was used. In the first model (Model A), profit was regressed only on sales and number of employees. In the second model (Model B), the dummy variable for type of industry was added to the model. The dummy is 1 if the company is in the computer industry and 0 if it is in the pharmaceutical industry. The sample only has data from companies in these two industries. Use the regression results to answer the following questions: f. (10 pts) Fully interpret the coefficient on the dummy variable. What exactly does it tell you? g. (5 pts) According to this model, is the change in profits the same for identical companies (same sales and number of employees) in the computer and pharmaceutical industry? Explain your answer. h. (10 pts) Draw the best fitting line for companies in the computer industry. How does it compare to those in the pharmaceutical industry? What changes? The intercept/slope/both


