Application Activity 1. If you were Simone, based on these analyses, how would you describe the relationship between a) gender and experiencing sexual harassment and
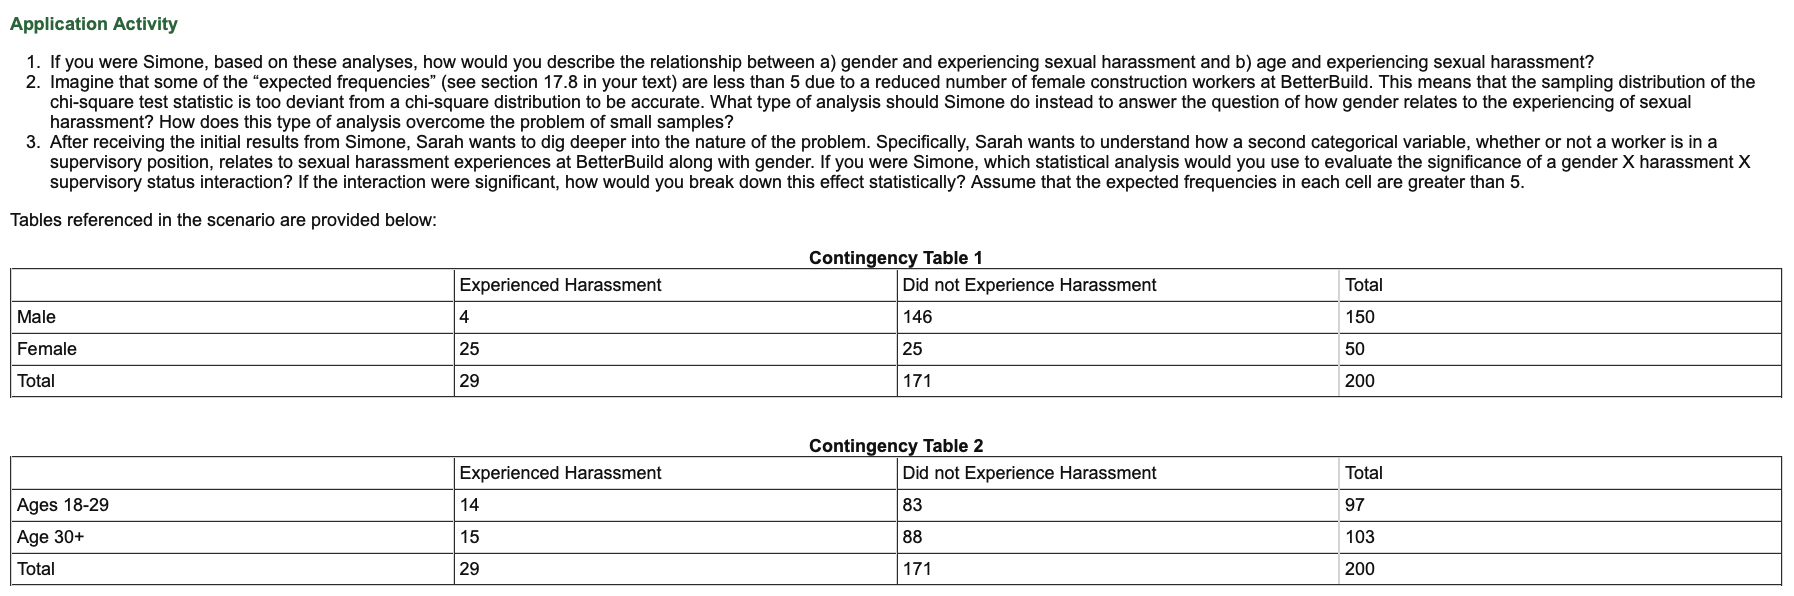
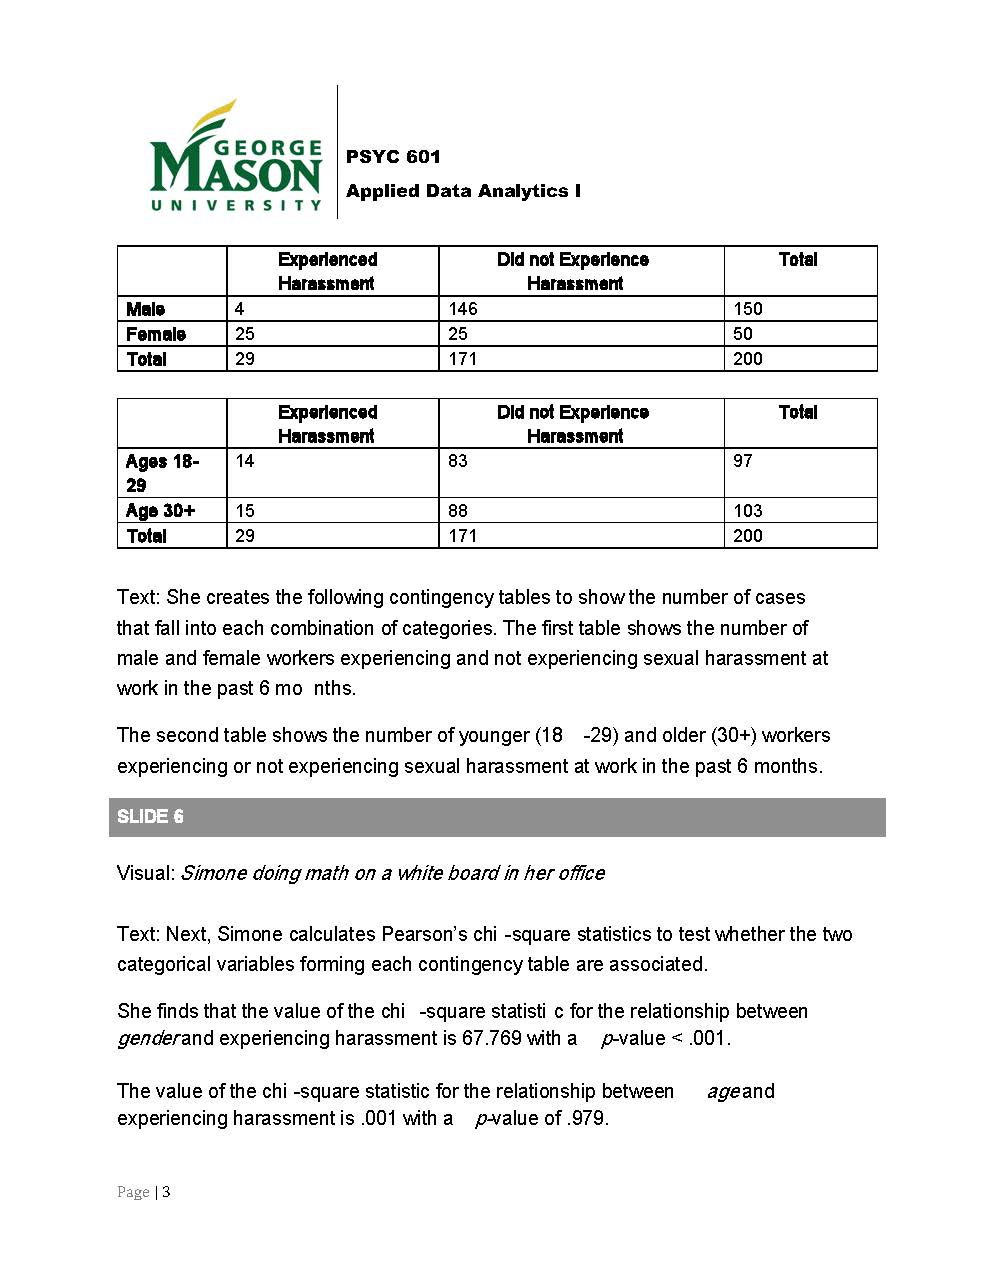
Application Activity 1. If you were Simone, based on these analyses, how would you describe the relationship between a) gender and experiencing sexual harassment and b) age and experiencing sexual harassment? 2. Imagine that some of the "expected frequencies" (see section 17.5 in your text) are less than 5 due to a reduced number of female construction workers at BetterBuild. This means that the sampling distribution of the chi-square test statistic is too deviant from a chi-square distribution to be accurate. What type of analysis should Simone do instead to answer the question of how gender relates to the experiencing of sexual harassment? How does this type of analysis overcome the problem of small samples? 3. After receiving the initial results from Simone, Sarah wants to dig deeper into the nature of the problem. Specically, Sarah wants to understand how a second categorical variable, whether or not a worker is in a supervisory position, relates to sexual harassment experiences at BetterBuild along with gender. If you were Simone, which statistical analysis would you use to evaluate the significance of a gender X harassment X supervisory status interaction? If the interaction were signicant. how would you break down this effect statistically? Assume that the expected frequencies in each cell are greater than 5. Tables referenced in the scenario are provided below: Contingency Table 1 Experienced Harassment Did not Experience Harassment Total Male 4 146 150 Female 25 25 50 Total 29 171 200 Contingency Table 2 Experienced Harassment Did not Experience Harassment Total Ages 1829 14 83 97 Age 30+ 15 56 103 Total 29 171 200 MASON PSYC 601 Applied Data Analytics I UNIVERSITY WEEK 7 ILLUSTRATED SCENARIO SLIDE 1 Visual: Simone in her office. "Diversity Consulting LLC" Text: Simone is an organizational consultant who specializes in matters related to diversity and inclusion. Clients typically seek out her assistance when they need to identify and resolve harassment and discrimination issues in their organizations. SLIDE 2 Visual: Sarah and Simone in Simone's office. Simone looks concerned, while Sarah looks frustrated. Speech bubble from Sarah: "We really need to do something about this..." Text: One of Simone's clients, Sarah, is the Director of Human Resources for a large construction company, BetterBuild . In the past 6 months or so, Sarah has noticed an increase in the number of sexual harassment claims at the company. She wants to investi gate the issue and foster a more inclusive work environment, so she's hired Simone to collect data and hopefully some shed light on the problem. SLIDE 3 Visual: Simone handing out surveys to construction workers (men and women) sitting on a curb and eating lunch Text: Simone has very little information to work with, so her first step is to figure out who is experiencing sexual harassment at BetterBuild Page | 1GEORGE MASON PSYC 601 UNIVERSITY Applied Data Analytics I Since BetterBuild's employees are on -site construction workers who don't have work computers or much time to step away from the site, Sim one decides to visit them during their lunch break to administer a very brief survey. The survey includes the following questions: 1. What is your gender? (male or fem ale ) 2. How old are you? (19-29 or 30+) 3. Have you experienced gender-based sexual harassment at work over the past 6 months? Please answer yes even if you have not form ally reported the in cident(s ) (yeso) SLIDE + Visual: Simone in her office with a tall stack of surveys on her desk, entering data into her computer Text: After a few days of visits to the construction sites at lunch, Simone has collected 200 survey responses. She enters the survey data into SPS S and prepares to conduct her analysis. Simone knows that because she measured only categorical variables (male or female; 18-29 or 30+ years of age; experienced sexual harassment or not), she can use Pearson's chi-square test to separately evaluate the relationships between a) gender and experi encing sexual harassment and b) age and experiencing sexual harassment at BetterBuild. (Of note, she could evaluate all three categorical variables together using a different type of analysis , but for instructional purposes, this example shows her using a simpler approach.) SLIDE 5 Visual: Simone looking at her computer screen, which has these tables on it: Page | 2MASON PSYC 601 Applied Data Analytics I UNIVERSITY Experienced Did not Experience Total Harassment Harassment Male 4 146 150 Female 25 25 50 Total 29 171 200 Experienced Did not Experience Total Harassment Harassment Ages 18- 14 83 97 29 Age 30+ 15 88 103 Total 29 171 200 Text: She creates the following contingency tables to show the number of cases that fall into each combination of categories. The first table shows the number of male and female workers experiencing and not experiencing sexual harassment at work in the past 6 mo nths. The second table shows the number of younger (18 -29) and older (30+) workers experiencing or not experiencing sexual harassment at work in the past 6 months. SLIDE 6 Visual: Simone doing math on a white board in her office Text: Next, Simone calculates Pearson's chi -square statistics to test whether the two categorical variables forming each contingency table are associated. She finds that the value of the chi -square statisti c for the relationship between genderand experiencing harassment is 67.769 with a p-value
Step by Step Solution
There are 3 Steps involved in it
Step: 1
Get Instant Access to Expert-Tailored Solutions
See step-by-step solutions with expert insights and AI powered tools for academic success
Step: 2
Step: 3
Ace Your Homework with AI
Get the answers you need in no time with our AI-driven, step-by-step assistance