Answered step by step
Verified Expert Solution
Question
1 Approved Answer
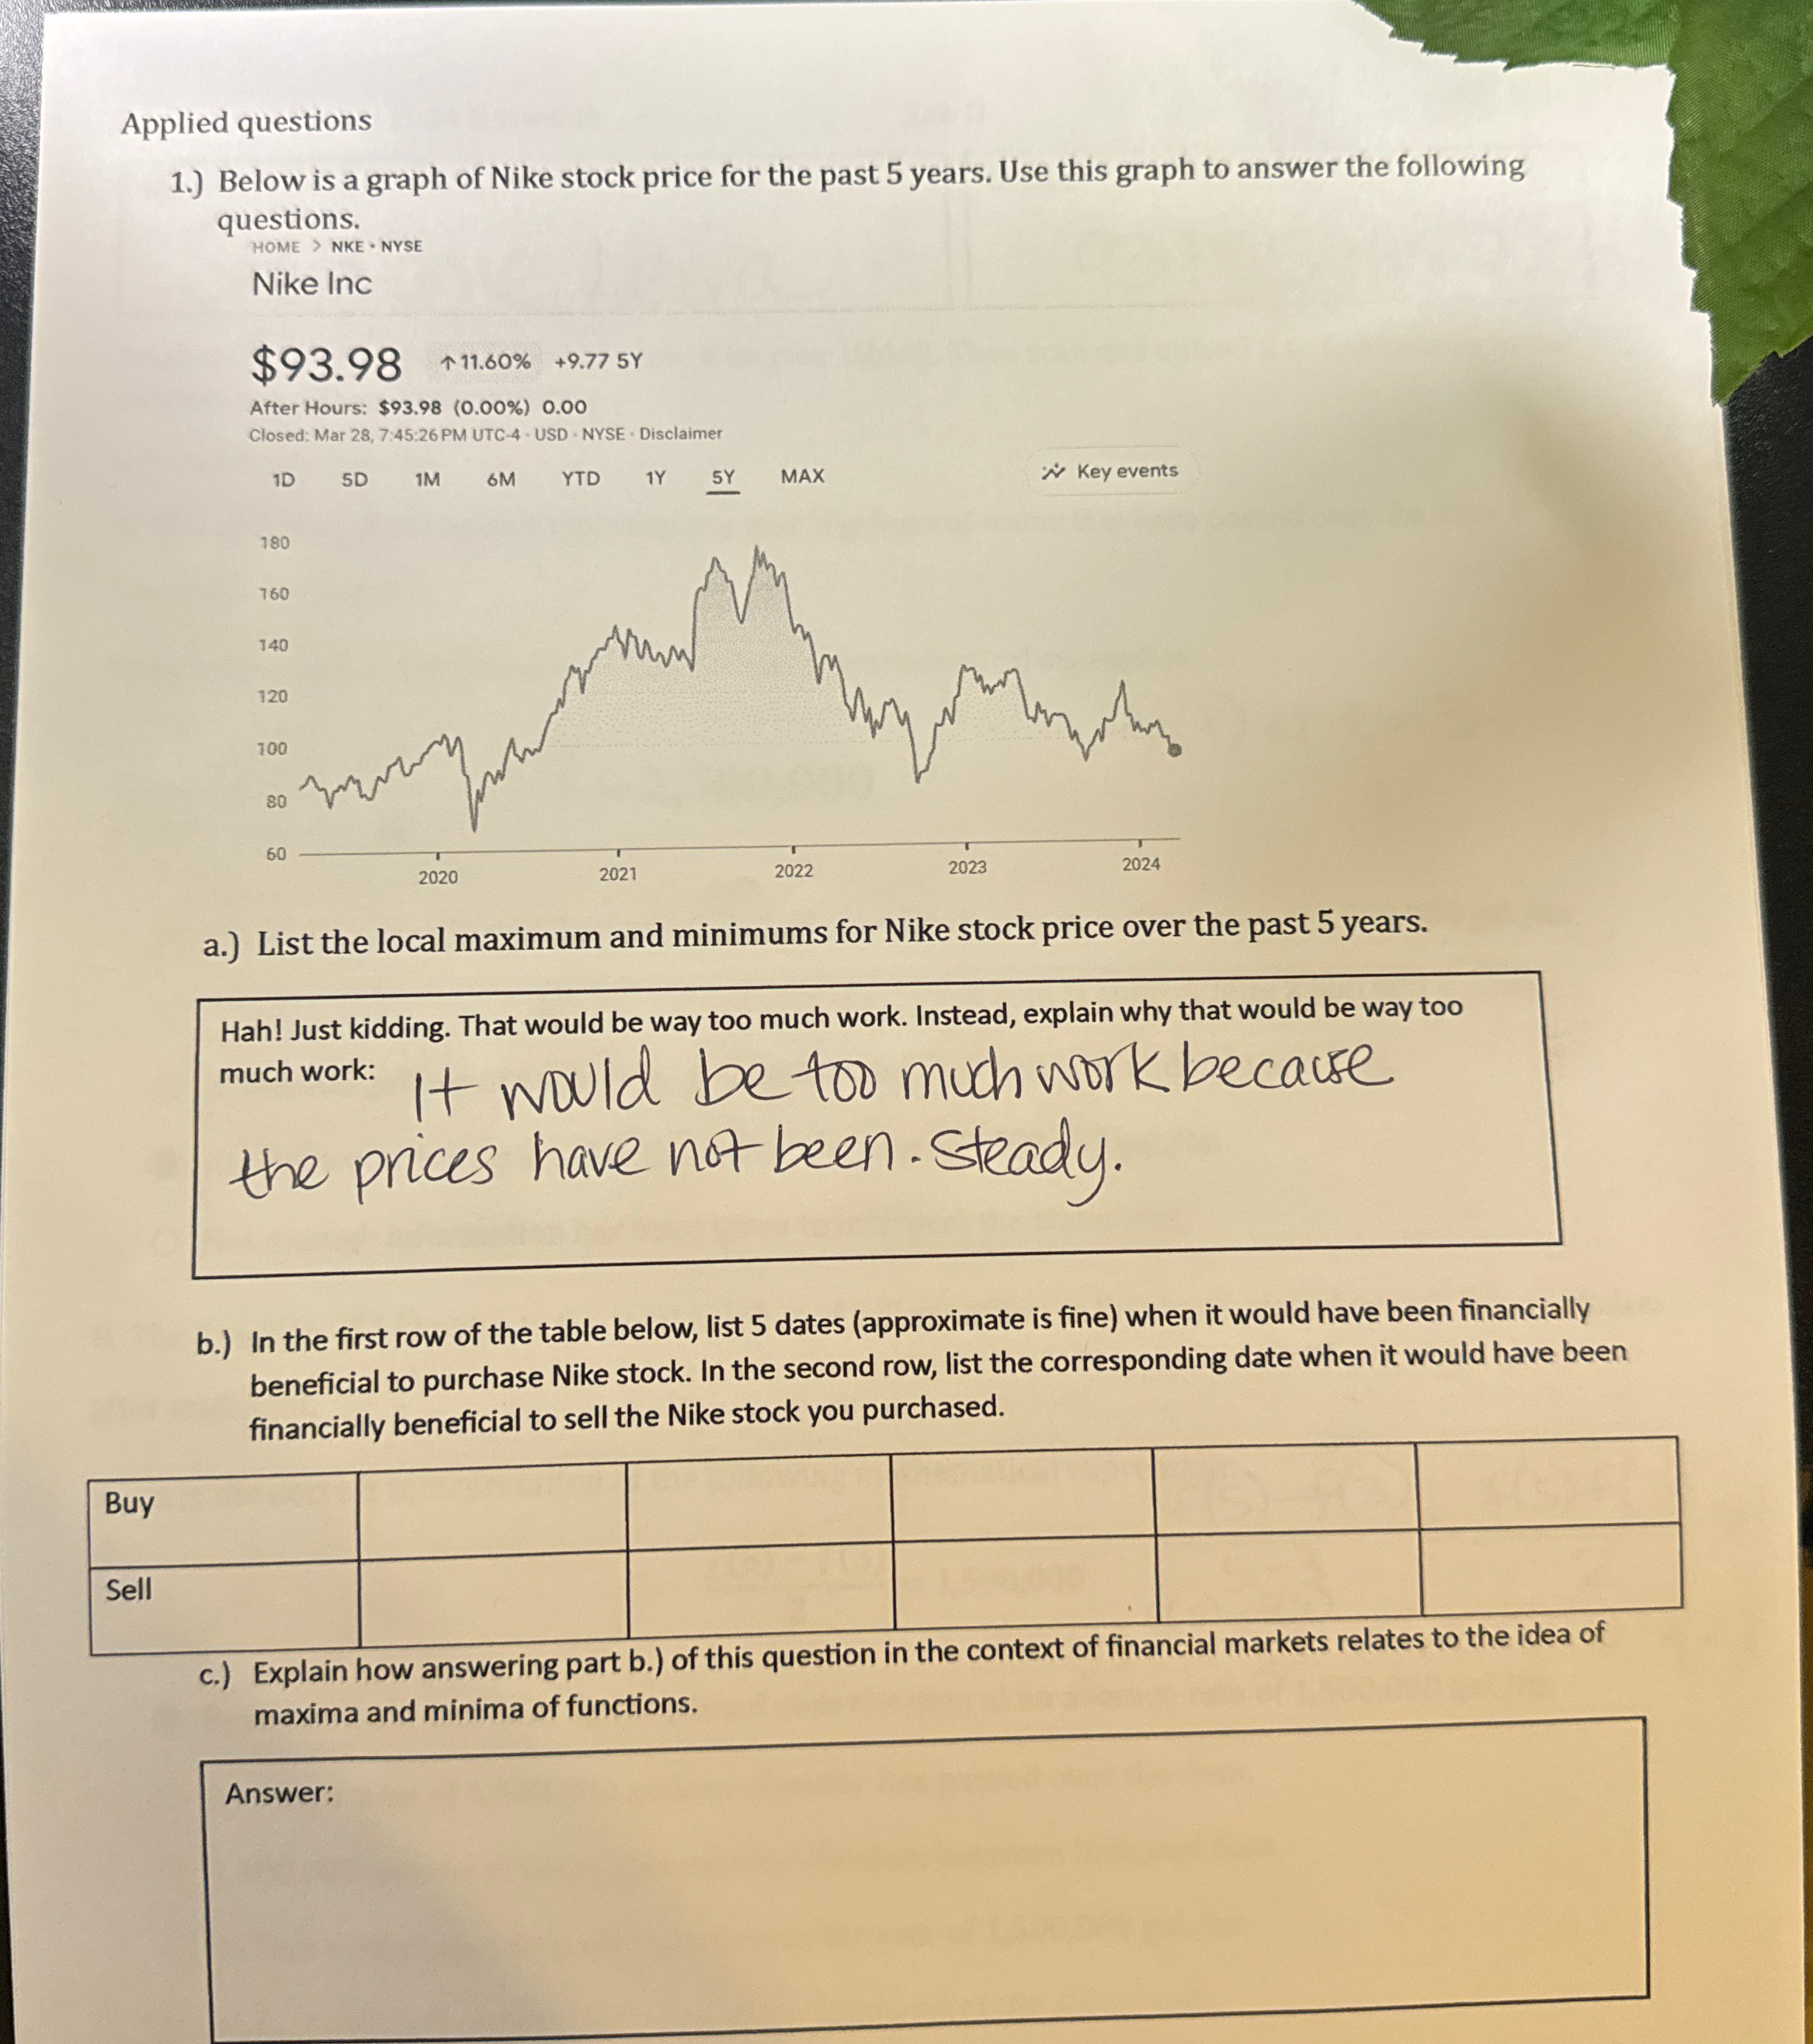
Applied questions 1 . ) Below is a graph of Nike stock price for the past 5 years. Use this graph to answer the following
Applied questions
Below is a graph of Nike stock price for the past years. Use this graph to answer the following questions.
HOME NKE NYSE
Nike Inc
$uarr
After Hours: $
Closed: Mar :: PM UTC USD NYSE Disclaimer
D
D
YTD
MAX
Key events
a List the local maximum and minimums for Nike stock price over the past years.
Hah! Just kidding. That would be way too much work. Instead, explain why that would be way too much work: It would be much work because the prices have not been. Steady.
b In the first row of the table below, list dates approximate is fine when it would have been financially beneficial to purchase Nike stock. In the second row, list the corresponding date when it would have been financially beneficial to sell the Nike stock you purchased.
tableBuySell
c Explain how answering part b of this question in the context of financial markets relates to the idea of maxima and minima of functions.

Step by Step Solution
There are 3 Steps involved in it
Step: 1

Get Instant Access to Expert-Tailored Solutions
See step-by-step solutions with expert insights and AI powered tools for academic success
Step: 2

Step: 3

Ace Your Homework with AI
Get the answers you need in no time with our AI-driven, step-by-step assistance
Get Started


