Answered step by step
Verified Expert Solution
Link Copied!

Question

1 Approved Answer

Applied Regression analysis & generalized linear models Auto-mpg analysis: The data file auto-mpg.data is avaliable at https: //archive.ics.uci.edu/m1/datasets/auto+mpg, and includes gas mileage info for a

Applied Regression analysis & generalized linear models image text in transcribed
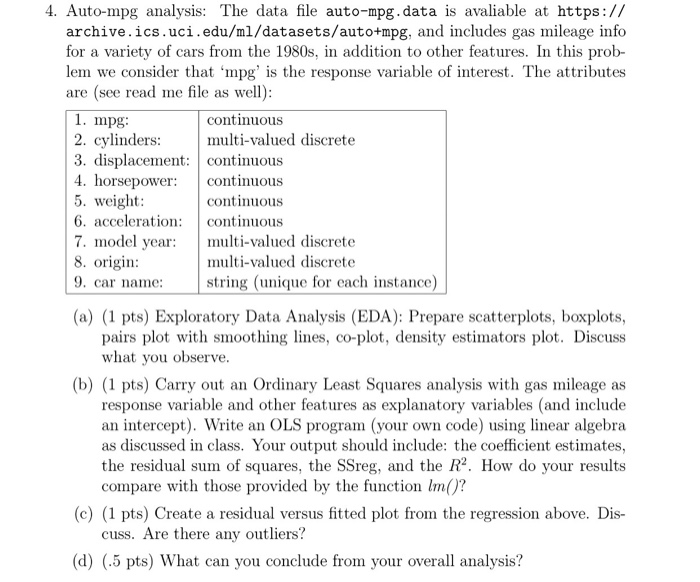
Auto-mpg analysis: The data file auto-mpg.data is avaliable at https: //archive.ics.uci.edu/m1/datasets/auto+mpg, and includes gas mileage info for a variety of cars from the 1980s, in addition to other features. In this problem we consider that 'mpg' is the response variable of interest. The attributes are (see read me file as well): (a) Exploratory Data Analysis (EDA): Prepare scatterplots, boxplots, pairs plot with smoothing lines, co-plot, density estimators plot. Discuss what you observe. (b) Carry out an Ordinary Least Squares analysis with gas mileage as response variable and other features as explanatory variables (and include an intercept). Write an OLS program (your own code) using linear algebra as discussed in class. Your output should include: the coefficient estimates, the residual sum of squares, the SSreg, and the R^2. How do your results compare with those provided by the function lm()? (c) Create a residual versus fitted plot from the regression above. Discuss. Are there any outliers? (d) What can you conclude from your overall analysis? Auto-mpg analysis: The data file auto-mpg.data is avaliable at https: //archive.ics.uci.edu/m1/datasets/auto+mpg, and includes gas mileage info for a variety of cars from the 1980s, in addition to other features. In this problem we consider that 'mpg' is the response variable of interest. The attributes are (see read me file as well): (a) Exploratory Data Analysis (EDA): Prepare scatterplots, boxplots, pairs plot with smoothing lines, co-plot, density estimators plot. Discuss what you observe. (b) Carry out an Ordinary Least Squares analysis with gas mileage as response variable and other features as explanatory variables (and include an intercept). Write an OLS program (your own code) using linear algebra as discussed in class. Your output should include: the coefficient estimates, the residual sum of squares, the SSreg, and the R^2. How do your results compare with those provided by the function lm()? (c) Create a residual versus fitted plot from the regression above. Discuss. Are there any outliers? (d) What can you conclude from your overall analysis

Step by Step Solution

There are 3 Steps involved in it

Step: 1

blur-text-image

Get Instant Access to Expert-Tailored Solutions

See step-by-step solutions with expert insights and AI powered tools for academic success

Step: 2

blur-text-image_2

Step: 3

blur-text-image_3

Ace Your Homework with AI

Get the answers you need in no time with our AI-driven, step-by-step assistance

Get Started

Recommended Textbook for

More Books

Students also viewed these Databases questions