Answered step by step
Verified Expert Solution
Question
1 Approved Answer
Apply DuPont Analysis and the Return on Assets % to evaluate J&J's overall financial performance. Use the information in J&J's Income Statement and Balance
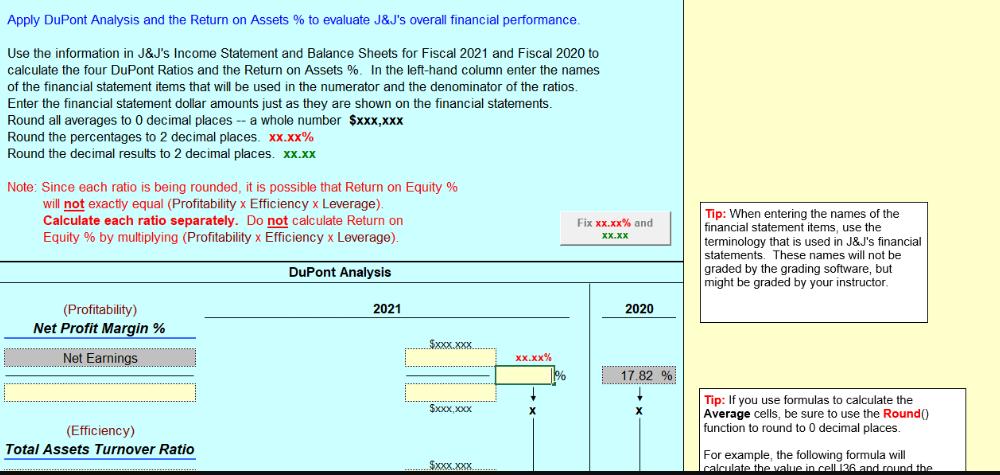
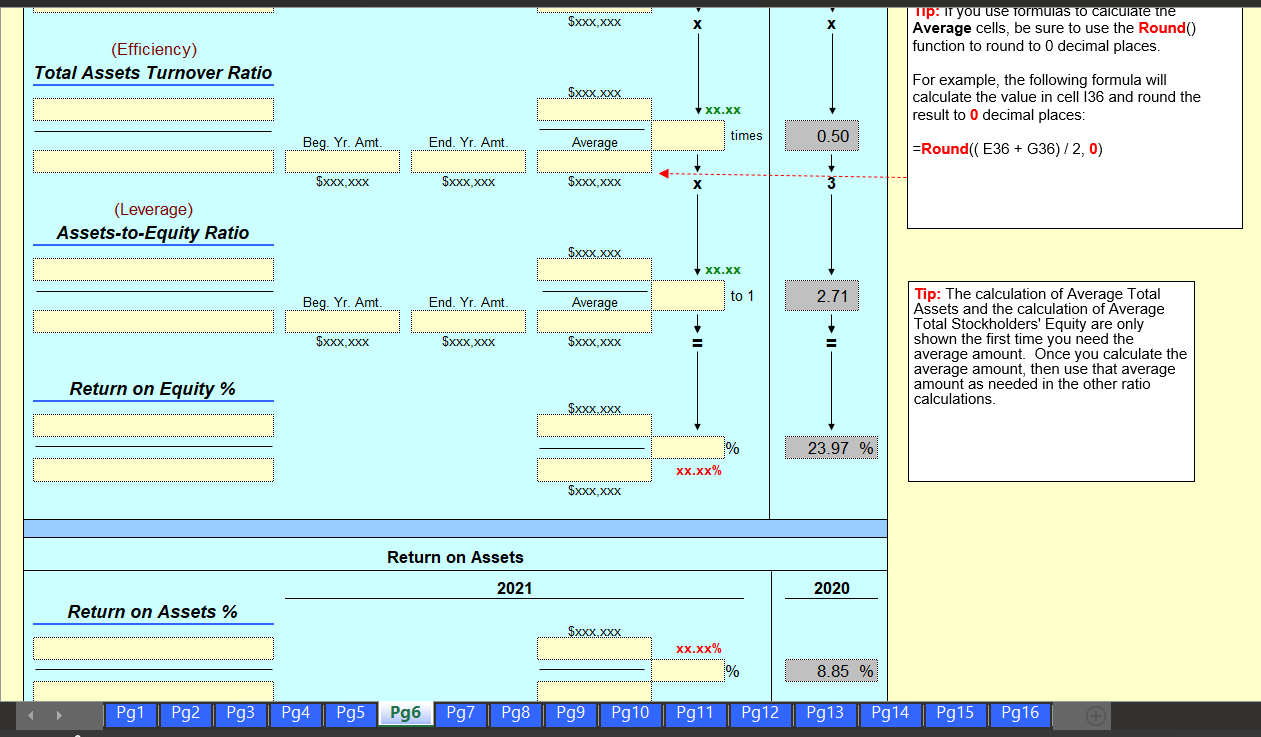
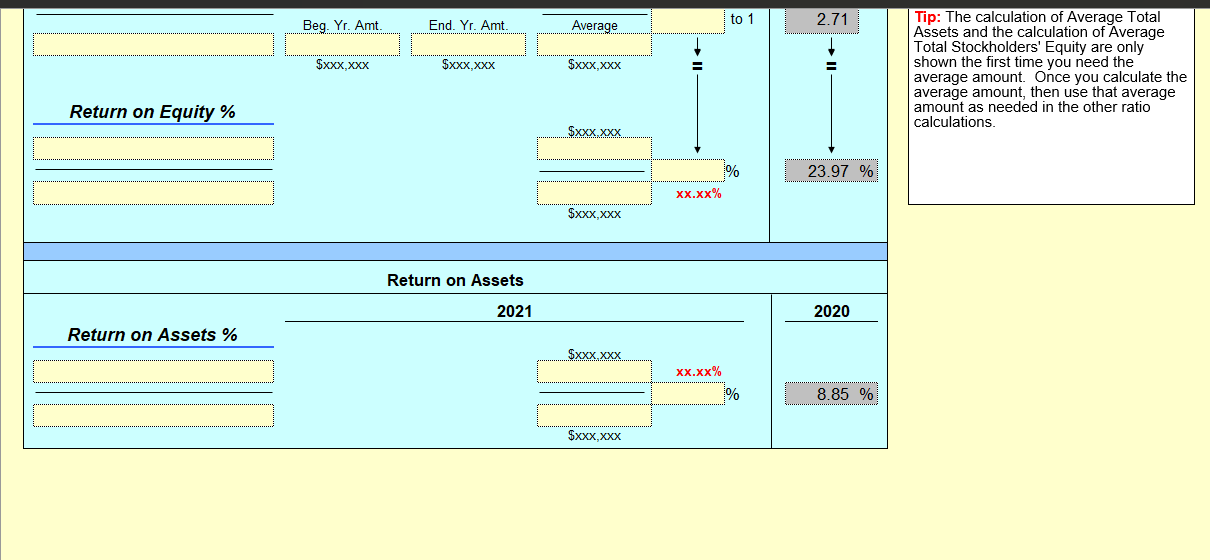
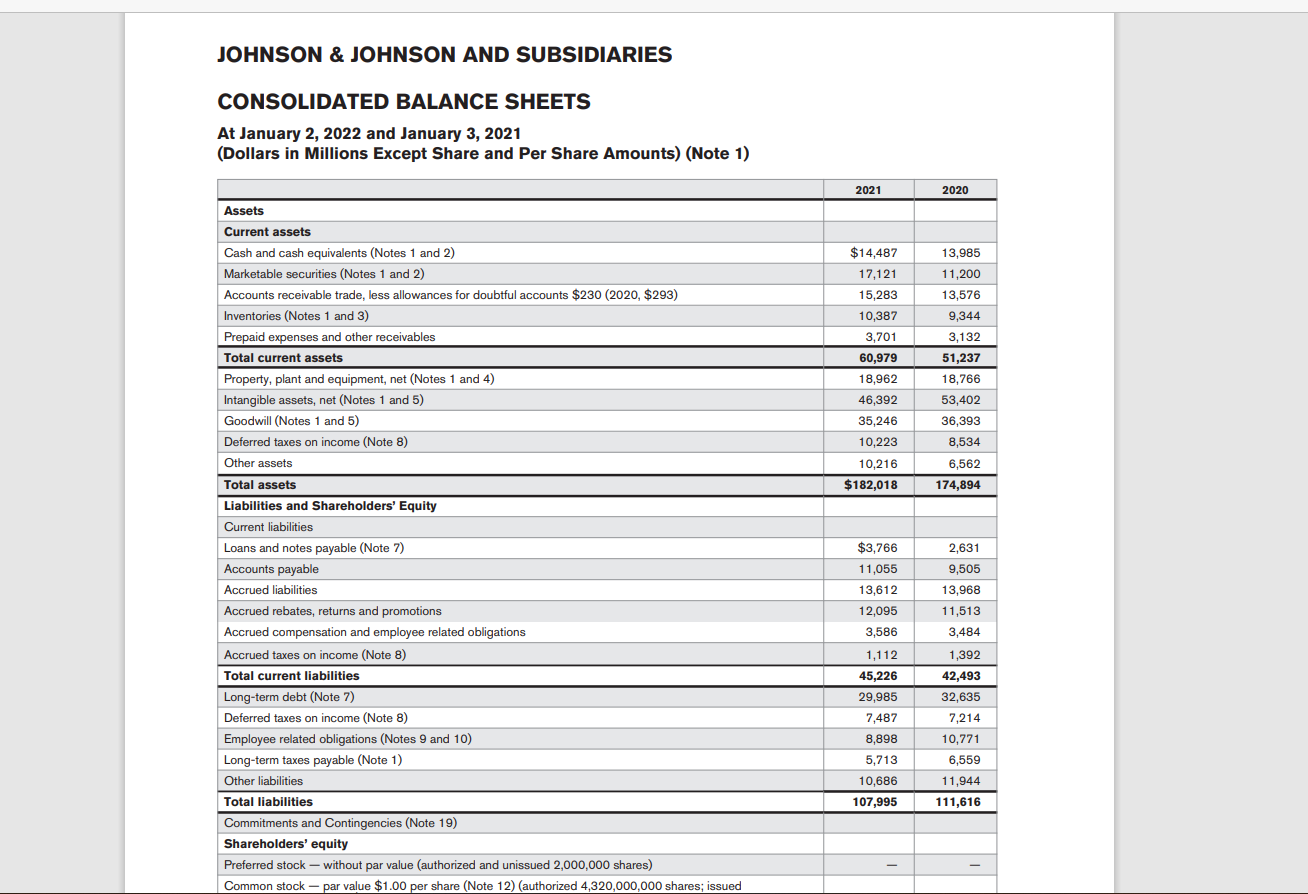
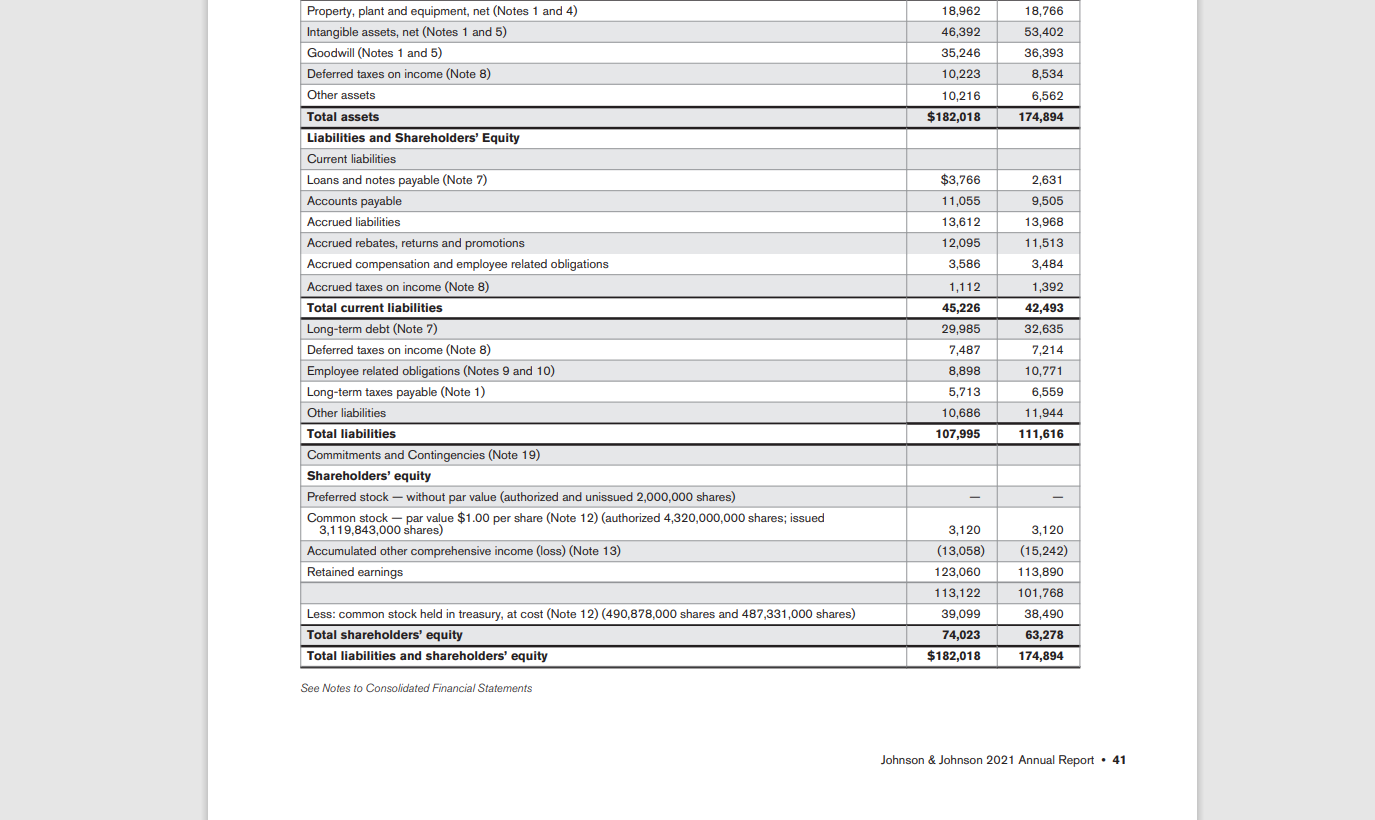
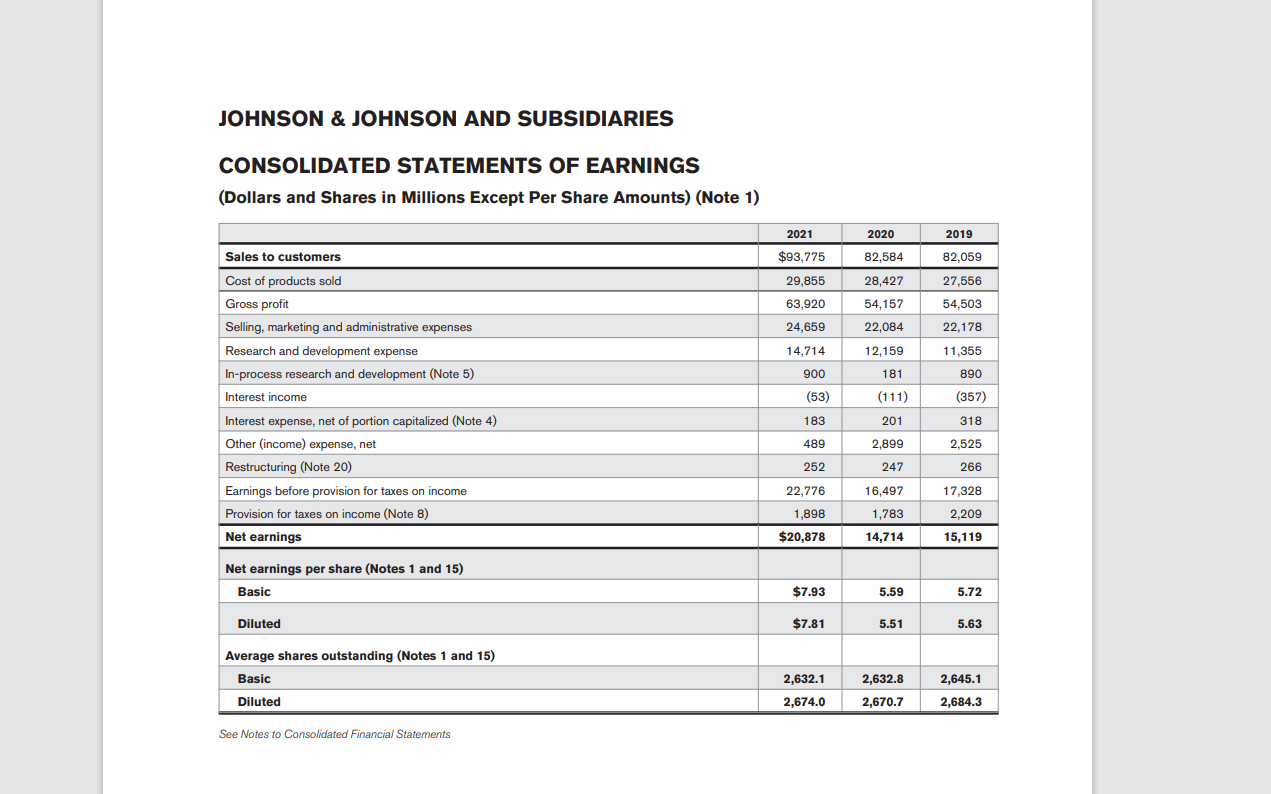
Apply DuPont Analysis and the Return on Assets % to evaluate J&J's overall financial performance. Use the information in J&J's Income Statement and Balance Sheets for Fiscal 2021 and Fiscal 2020 to calculate the four DuPont Ratios and the Return on Assets %. In the left-hand column enter the names of the financial statement items that will be used in the numerator and the denominator of the ratios. Enter the financial statement dollar amounts just as they are shown on the financial statements. Round all averages to 0 decimal places -- a whole number $xxx,xxx Round the percentages to 2 decimal places. xx.xx% Round the decimal results to 2 decimal places. xx.xx Note: Since each ratio is being rounded, it is possible that Return on Equity % will not exactly equal (Profitability x Efficiency x Leverage). Calculate each ratio separately. Do not calculate Return on Equity % by multiplying (Profitability x Efficiency x Leverage). Fix xx.xx% and XX.XX (Profitability) Net Profit Margin % Net Earnings DuPont Analysis 2021 Sxxx xx.xx% $xxx.xxxxx (Efficiency) Total Assets Turnover Ratio $xxx.xxx. 2020 Tip: When entering the names of the financial statement items, use the terminology that is used in J&J's financial statements. These names will not be graded by the grading software, but might be graded by your instructor. 17.82 % X Tip: If you use formulas to calculate the Average cells, be sure to use the Round() function to round to 0 decimal places. For example, the following formula will calculate the value in cell 136 and round the (Efficiency) Total Assets Turnover Ratio (Leverage) Assets-to-Equity Ratio Return on Equity % $XXX,XXX x $XXX.XXX XX.XX times 0.50 Beg. Yr. Amt. End. Yr. Amt. Average $xxx,xxx $XXX,XXX $xxx,XXX x $XXX.XXX XX.XX to 1 2.71 Beg. Yr. Amt. End. Yr. Amt. Average $xxx,xxx $XXX,XXX $xxx,XXX $XXX.XXX % 23.97 % xx.xx% $XXX.XXX Tip: If you use formulas to calculate the Average cells, be sure to use the Round() function to round to 0 decimal places. For example, the following formula will calculate the value in cell 136 and round the result to 0 decimal places: =Round((E36 + G36)/2,0) Tip: The calculation of Average Total Assets and the calculation of Average Total Stockholders' Equity are only shown the first time you need the average amount. Once you calculate the average amount, then use that average amount as needed in the other ratio calculations. Return on Assets 2021 2020 Return on Assets % $XXX.XXX xx.xx% % 8.85 % Pg1 Pg2 Pg3 Pg4 Pg5 Pg6 Pg7 Pg8 Pg9 Pg10 Pg11 Pg12 Pg13 Pg14 Pg15 Pg16 Return on Equity % Return on Assets % Beg. Yr. Amt. to 1 2.71 End. Yr. Amt. Average $XXX,XXX $XXX,XXX $XXX,XXX Return on Assets 2021 $XXX.XXX % 23.97 % xx.xx% $xxx,xxx 2020 $XXX.XXX xx.xx% % 8.85 % $XXX,XXX Tip: The calculation of Average Total Assets and the calculation of Average Total Stockholders' Equity are only shown the first time you need the average amount. Once you calculate the average amount, then use that average amount as needed in the other ratio calculations. JOHNSON & JOHNSON AND SUBSIDIARIES CONSOLIDATED BALANCE SHEETS At January 2, 2022 and January 3, 2021 (Dollars in Millions Except Share and Per Share Amounts) (Note 1) Assets Current assets 2021 2020 Cash and cash equivalents (Notes 1 and 2) $14,487 13,985 Marketable securities (Notes 1 and 2) 17,121 11,200 Accounts receivable trade, less allowances for doubtful accounts $230 (2020, $293) 15,283 13,576 Inventories (Notes 1 and 3) 10,387 9,344 Prepaid expenses and other receivables 3,701 3,132 Total current assets 60,979 51,237 Property, plant and equipment, net (Notes 1 and 4) 18,962 18,766 Intangible assets, net (Notes 1 and 5) 46,392 53,402 Goodwill (Notes 1 and 5) Deferred taxes on income (Note 8) Other assets Total assets Liabilities and Shareholders' Equity Current liabilities 35,246 36,393 10,223 8,534 10,216 6,562 $182,018 174,894 Loans and notes payable (Note 7) $3,766 2,631 Accounts payable 11,055 9,505 Accrued liabilities 13,612 13,968 Accrued rebates, returns and promotions 12,095 11,513 Accrued compensation and employee related obligations 3,586 3,484 Accrued taxes on income (Note 8) 1,112 1,392 Total current liabilities 45,226 42,493 Long-term debt (Note 7) 29,985 32,635 Deferred taxes on income (Note 8) 7,487 7,214 Employee related obligations (Notes 9 and 10) 8,898 10,771 Long-term taxes payable (Note 1) 5,713 6,559 Other liabilities 10,686 11,944 107,995 111,616 Total liabilities Commitments and Contingencies (Note 19) Shareholders' equity Preferred stock - without par value (authorized and unissued 2,000,000 shares) Common stock - par value $1.00 per share (Note 12) (authorized 4,320,000,000 shares; issued Property, plant and equipment, net (Notes 1 and 4) 18,962 18,766 Intangible assets, net (Notes 1 and 5) 46,392 53,402 Goodwill (Notes 1 and 5) 35,246 36,393 Deferred taxes on income (Note 8) 10,223 8,534 Other assets Total assets Liabilities and Shareholders' Equity Current liabilities 10,216 6,562 $182,018 174,894 Loans and notes payable (Note 7) $3,766 2,631 Accounts payable 11,055 9,505 Accrued liabilities 13,612 13,968 Accrued rebates, returns and promotions 12,095 11,513 Accrued compensation and employee related obligations 3,586 3,484 Accrued taxes on income (Note 8) 1,112 1,392 Total current liabilities 45,226 42,493 Long-term debt (Note 7) 29,985 32,635 Deferred taxes on income (Note 8) 7,487 7,214 Employee related obligations (Notes 9 and 10) 8,898 10,771 Long-term taxes payable (Note 1) 5,713 6,559 Other liabilities 10,686 11,944 107,995 111,616 Total liabilities Commitments and Contingencies (Note 19) Shareholders' equity Preferred stock - without par value (authorized and unissued 2,000,000 shares) Common stock - par value $1.00 per share (Note 12) (authorized 4,320,000,000 shares; issued 3,119,843,000 shares) 3,120 3,120 Accumulated other comprehensive income (loss) (Note 13) (13,058) (15,242) Retained earnings 123,060 113,890 113,122 101,768 Less: common stock held in treasury, at cost (Note 12) (490,878,000 shares and 487,331,000 shares) Total shareholders' equity 39,099 38,490 74,023 63,278 Total liabilities and shareholders' equity $182,018 174,894 See Notes to Consolidated Financial Statements Johnson & Johnson 2021 Annual Report 41 JOHNSON & JOHNSON AND SUBSIDIARIES CONSOLIDATED STATEMENTS OF EARNINGS (Dollars and Shares in Millions Except Per Share Amounts) (Note 1) 2021 2020 2019 Sales to customers $93,775 82,584 82,059 Cost of products sold Gross profit 29,855 28,427 27,556 63,920 54,157 54,503 Selling, marketing and administrative expenses 24,659 22,084 22,178 Research and development expense 14,714 12,159 11,355 In-process research and development (Note 5) 900 181 890 Interest income (53) (111) (357) Interest expense, net of portion capitalized (Note 4) 183 201 318 Other (income) expense, net 489 2,899 2,525 Restructuring (Note 20) 252 247 266 Earnings before provision for taxes on income 22,776 16,497 17,328 Provision for taxes on income (Note 8) 1,898 1,783 2,209 Net earnings $20,878 14,714 15,119 Net earnings per share (Notes 1 and 15) Basic Diluted $7.93 5.59 5.72 $7.81 5.51 5.63 Average shares outstanding (Notes 1 and 15) Basic Diluted 2,632.1 2,632.8 2,645.1 2,674.0 2,670.7 2,684.3 See Notes to Consolidated Financial Statements
Step by Step Solution
There are 3 Steps involved in it
Step: 1

Get Instant Access to Expert-Tailored Solutions
See step-by-step solutions with expert insights and AI powered tools for academic success
Step: 2

Step: 3

Ace Your Homework with AI
Get the answers you need in no time with our AI-driven, step-by-step assistance
Get Started


