

Question
Apply Dynamic Analysis to incorporate uncertainties in your analysis. State and Justify the Assumptions for the factors selected in the dynamic analysis. **If you can
Apply Dynamic Analysis to incorporate uncertainties in your analysis. State and Justify the Assumptions for the factors selected in the dynamic analysis.
**If you can not find the answer. How do you do Dynamic Analysis?**
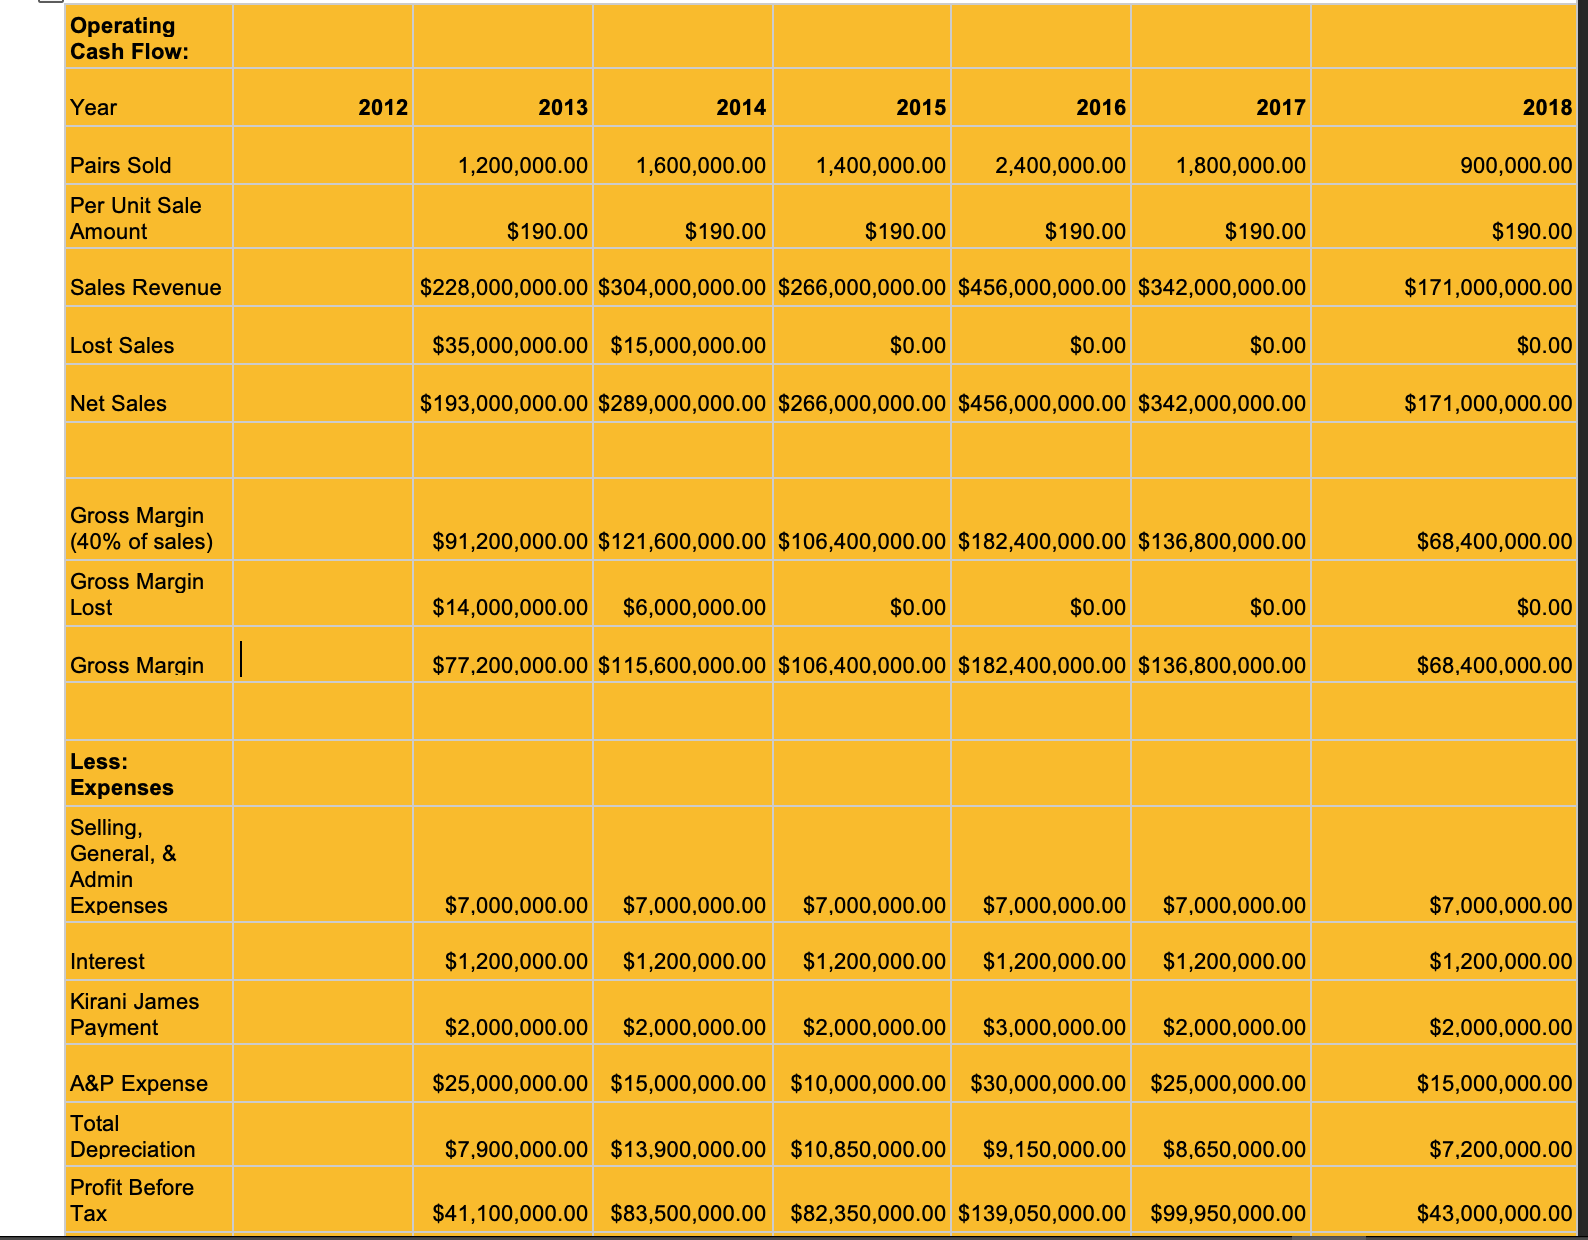
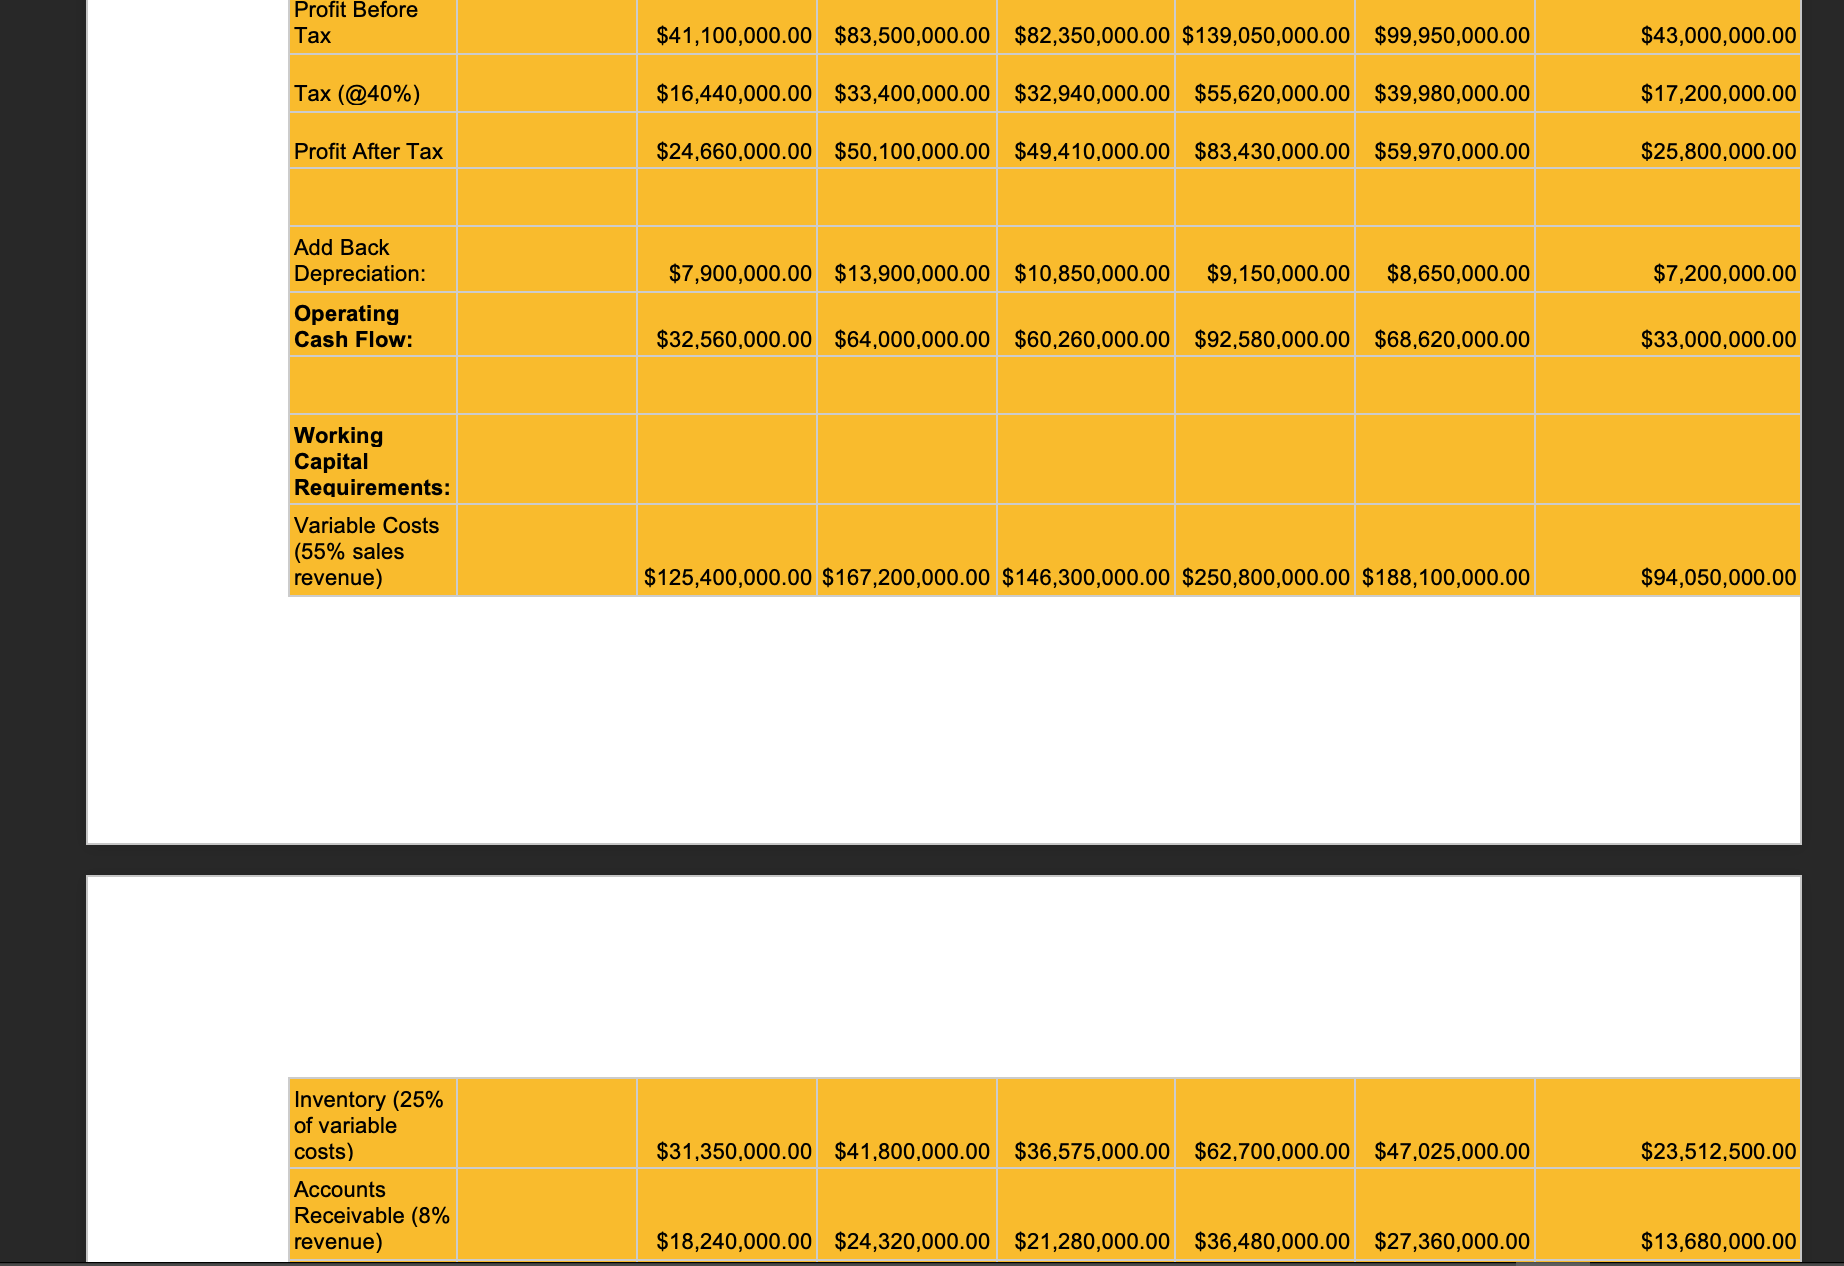
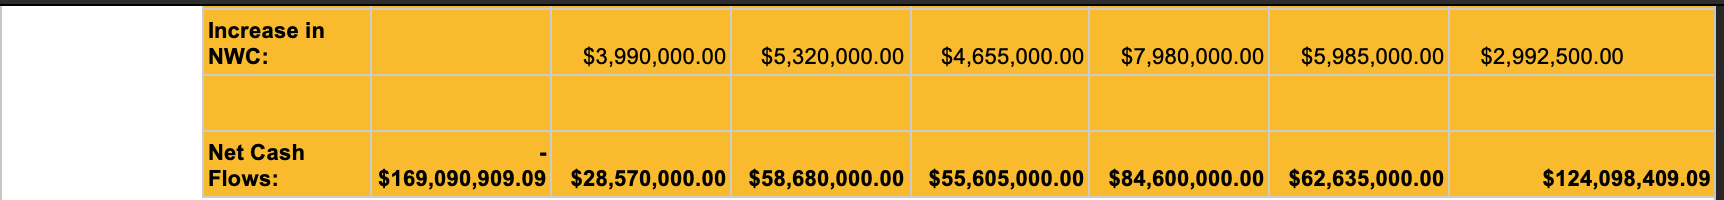
Operating Cash Flow: Year 2012 2013 2014 2015 2016 2017 2018 Pairs Sold 1,200,000.00 1,600,000.00 1,400,000.00 2,400,000.00 1,800,000.00 900,000.00 Per Unit Sale Amount $190.00 $190.00 $190.00 $190.00 $190.00 $190.00 Sales Revenue $228,000,000.00 $304,000,000.00 $266,000,000.00 $456,000,000.00 $342,000,000.00 $171,000,000.00 Lost Sales $35,000,000.00 $15,000,000.00 $0.00 $0.00 $0.00 $0.00 Net Sales $193,000,000.00 $289,000,000.00 $266,000,000.00 $456,000,000.00 $342,000,000.00 $171,000,000.00 $91,200,000.00 $121,600,000.00 $ 106,400,000.00 $182,400,000.00 $ 136,800,000.00 $68,400,000.00 Gross Margin (40% of sales) Gross Margin Lost $14,000,000.00 $6,000,000.00 $0.00 $0.00 $0.00 $0.00 Gross Margin | $77,200,000.00 $115,600,000.00 $106,400,000.00 $182,400,000.00 $136,800,000.00 $68,400,000.00 Less: Expenses Selling, General, & Admin Expenses $7,000,000.00 $7,000,000.00 $7,000,000.00 $7,000,000.00 $7,000,000.00 $7,000,000.00 Interest $1,200,000.00 $1,200,000.00 $1,200,000.00 $1,200,000.00 $1,200,000.00 $1,200,000.00 Kirani James Payment $2,000,000.00 $2,000,000.00 $2,000,000.00 $3,000,000.00 $2,000,000.00 $2,000,000.00 A&P Expense $25,000,000.00 $15,000,000.00 $10,000,000.00 $30,000,000.00 $25,000,000.00 $15,000,000.00 Total Depreciation $7,900,000.00 $13,900,000.00 $10,850,000.00 $9,150,000.00 $8,650,000.00 $7,200,000.00 Profit Before Tax $41,100,000.00 $83,500,000.00 $82,350,000.00 $139,050,000.00 $99,950,000.00 $43,000,000.00 Profit Before Tax $41,100,000.00 $83,500,000.00 $82,350,000.00 $139,050,000.00 $99,950,000.00 $43,000,000.00 Tax (@40%) $16,440,000.00 $33,400,000.00 $32,940,000.00 $55,620,000.00 $39,980,000.00 $17,200,000.00 Profit After Tax $24,660,000.00 $50,100,000.00 $49,410,000.00 $83,430,000.00 $59,970,000.00 $25,800,000.00 $7,900,000.00 $13,900,000.00 $10,850,000.00 $9,150,000.00 $8,650,000.00 $7,200,000.00 Add Back Depreciation: Operating Cash Flow: $32,560,000.00 $64,000,000.00 $60,260,000.00 $92,580,000.00 $68,620,000.00 $33,000,000.00 Working Capital Requirements: Variable Costs (55% sales revenue) $125,400,000.00 $167,200,000.00 $146,300,000.00 $250,800,000.00 $188,100,000.00 $94,050,000.00 $31,350,000.00 $41,800,000.00 $36,575,000.00 $62,700,000.00 $47,025,000.00 $23,512,500.00 Inventory (25% of variable costs) Accounts Receivable (8% revenue) $18,240,000.00 $24,320,000.00 $21,280,000.00 $36,480,000.00 $27,360,000.00 $13,680,000.00 Increase in NWC: $3,990,000.00 $5,320,000.00 $4,655,000.00 $7,980,000.00 $5,985,000.00 $2,992,500.00 Net Cash Flows: $169,090,909.09 $28,570,000.00 $58,680,000.00 $55,605,000.00 $84,600,000.00 $62,635,000.00 $124,098,409.09 Operating Cash Flow: Year 2012 2013 2014 2015 2016 2017 2018 Pairs Sold 1,200,000.00 1,600,000.00 1,400,000.00 2,400,000.00 1,800,000.00 900,000.00 Per Unit Sale Amount $190.00 $190.00 $190.00 $190.00 $190.00 $190.00 Sales Revenue $228,000,000.00 $304,000,000.00 $266,000,000.00 $456,000,000.00 $342,000,000.00 $171,000,000.00 Lost Sales $35,000,000.00 $15,000,000.00 $0.00 $0.00 $0.00 $0.00 Net Sales $193,000,000.00 $289,000,000.00 $266,000,000.00 $456,000,000.00 $342,000,000.00 $171,000,000.00 $91,200,000.00 $121,600,000.00 $ 106,400,000.00 $182,400,000.00 $ 136,800,000.00 $68,400,000.00 Gross Margin (40% of sales) Gross Margin Lost $14,000,000.00 $6,000,000.00 $0.00 $0.00 $0.00 $0.00 Gross Margin | $77,200,000.00 $115,600,000.00 $106,400,000.00 $182,400,000.00 $136,800,000.00 $68,400,000.00 Less: Expenses Selling, General, & Admin Expenses $7,000,000.00 $7,000,000.00 $7,000,000.00 $7,000,000.00 $7,000,000.00 $7,000,000.00 Interest $1,200,000.00 $1,200,000.00 $1,200,000.00 $1,200,000.00 $1,200,000.00 $1,200,000.00 Kirani James Payment $2,000,000.00 $2,000,000.00 $2,000,000.00 $3,000,000.00 $2,000,000.00 $2,000,000.00 A&P Expense $25,000,000.00 $15,000,000.00 $10,000,000.00 $30,000,000.00 $25,000,000.00 $15,000,000.00 Total Depreciation $7,900,000.00 $13,900,000.00 $10,850,000.00 $9,150,000.00 $8,650,000.00 $7,200,000.00 Profit Before Tax $41,100,000.00 $83,500,000.00 $82,350,000.00 $139,050,000.00 $99,950,000.00 $43,000,000.00 Profit Before Tax $41,100,000.00 $83,500,000.00 $82,350,000.00 $139,050,000.00 $99,950,000.00 $43,000,000.00 Tax (@40%) $16,440,000.00 $33,400,000.00 $32,940,000.00 $55,620,000.00 $39,980,000.00 $17,200,000.00 Profit After Tax $24,660,000.00 $50,100,000.00 $49,410,000.00 $83,430,000.00 $59,970,000.00 $25,800,000.00 $7,900,000.00 $13,900,000.00 $10,850,000.00 $9,150,000.00 $8,650,000.00 $7,200,000.00 Add Back Depreciation: Operating Cash Flow: $32,560,000.00 $64,000,000.00 $60,260,000.00 $92,580,000.00 $68,620,000.00 $33,000,000.00 Working Capital Requirements: Variable Costs (55% sales revenue) $125,400,000.00 $167,200,000.00 $146,300,000.00 $250,800,000.00 $188,100,000.00 $94,050,000.00 $31,350,000.00 $41,800,000.00 $36,575,000.00 $62,700,000.00 $47,025,000.00 $23,512,500.00 Inventory (25% of variable costs) Accounts Receivable (8% revenue) $18,240,000.00 $24,320,000.00 $21,280,000.00 $36,480,000.00 $27,360,000.00 $13,680,000.00 Increase in NWC: $3,990,000.00 $5,320,000.00 $4,655,000.00 $7,980,000.00 $5,985,000.00 $2,992,500.00 Net Cash Flows: $169,090,909.09 $28,570,000.00 $58,680,000.00 $55,605,000.00 $84,600,000.00 $62,635,000.00 $124,098,409.09Step by Step Solution
There are 3 Steps involved in it
Step: 1

Get Instant Access to Expert-Tailored Solutions
See step-by-step solutions with expert insights and AI powered tools for academic success
Step: 2

Step: 3
Ace Your Homework with AI
Get the answers you need in no time with our AI-driven, step-by-step assistance
Get Started
Investments Analysis and Management
Authors: Charles P. Jones
12th edition
978-1118475904, 1118475909, 1118363299, 978-1118363294