Answered step by step
Verified Expert Solution
Link Copied!

Question

1 Approved Answer

Apply the decision tree model in Figure 1 on the test set given in Table 2 and answer the following questions ID Table 2 Test
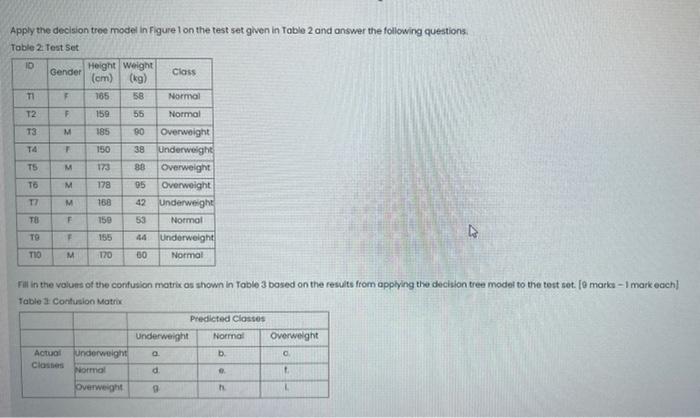
image text in transcribed
Apply the decision tree model in Figure 1 on the test set given in Table 2 and answer the following questions ID Table 2 Test Set Gender Height Weight (cm) (kg) Class TI F 165 58 Normal T2 F 150 55 Normal T3 M 185 90 Overweight TA 150 38 Underweight TS 173 88 Overweight 178 95 Overweight T7 M 168 42 Underweight TB 159 53 Normal TO 155 44 Underweight TIO M 170 00 Normal EEEE $ Fil in the values of the confusion motrix as shown in Tablo 3 based on the results from applying the decision trea model to the test sot. ( marks - 1 mark each) Table Confusion Matrix Predicted Classes Underweight Normal Overweight Actual Underweight Close Normal d. Overweight a b

Step by Step Solution

There are 3 Steps involved in it

Step: 1

blur-text-image

Get Instant Access to Expert-Tailored Solutions

See step-by-step solutions with expert insights and AI powered tools for academic success

Step: 2

blur-text-image

Step: 3

blur-text-image

Ace Your Homework with AI

Get the answers you need in no time with our AI-driven, step-by-step assistance

Get Started

Recommended Textbook for

More Books

Students also viewed these Databases questions

Question

How can overgrazing of rangeland lead to desertification?

Answered: 1 week ago