Question
Apply vertical analysis using percentage of total revenues to the consolidated statement of income . Please include one column each with your results for 2021
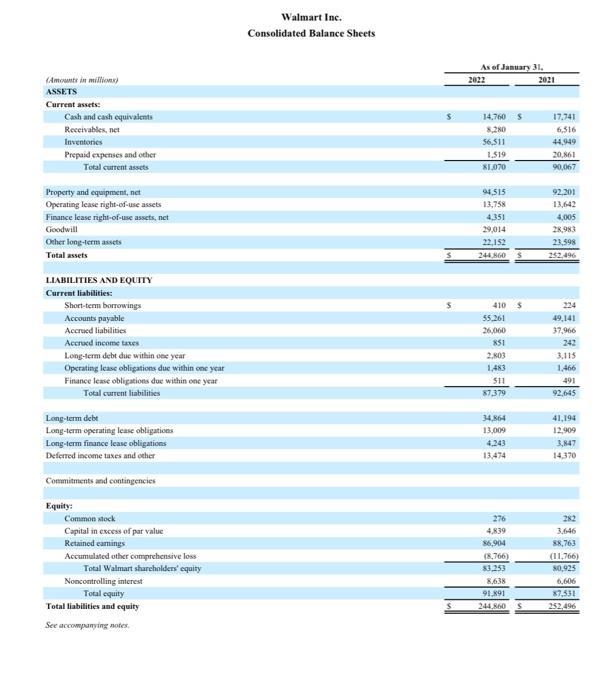
Apply vertical analysis using percentage of total revenues to the consolidated statement of income . Please include one column each with your results for 2021 and 2022 in the document you provide back to me. Apply horizontal analysis to the consolidated balance sheet . Please calculate percentages for every line with an amount on both the income statement and balance sheet. If a specific line item does not have an amount for one of the years, you may either put a zero, a dash, or leave it blank. Please list the name of the line along with the percentage (vertical analysis) or
percentage increase/decrease (horizontal analysis) - for example "net income”: -3% or
"cash and cash equivalents”: +2%
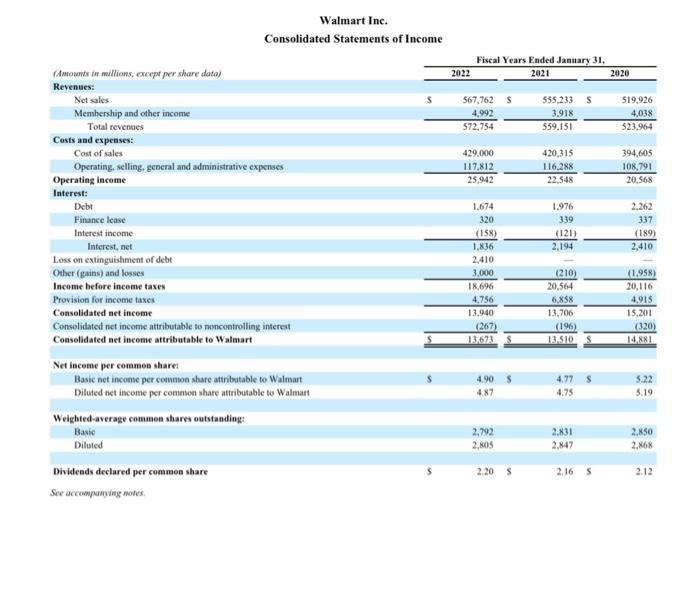
(Amounts in millions, except per share data) Revenues: Net sales Membership and other income Total revenues Costs and expenses: Cost of sales Operating, selling, general and administrative expenses Operating income Interest: Debt Finance lease Interest income Interest, net Loss on extinguishment of debt Other (gains) and losses Income before income taxes Provision for income taxes Walmart Inc. Consolidated Statements of Income Consolidated net income Consolidated net income attributable to noncontrolling interest Consolidated net income attributable to Walmart Net income per common share: Basic net income per common share attributable to Walmart Diluted net income per common share attributable to Walmart Weighted average common shares outstanding: Basic Diluted Dividends declared per common share See accompanying notes. S 2022 Fiscal Years Ended January 31, 2021 567,762 S 4,992 572,754 429,000 117,812 25,942 1,674 320 (158) 1,836 2,410 3,000 18,696 4,756 13,940 (267) 13,673 4.90 4.87 2,792 2,805 S 2.20 S 555,233 S 3,918 559,151 420,315 116,288 22,548 1,976 339 (121) 2,194 (210) 20,564 6,858 13,706 (196) 13.510 4.77 S 4.75 2,831 2,847 2.16 S 2020 519,926 4,038 523,964 394,605 108,791 20,568 2,262 337 (189) 2,410 (1.958) 20,116 4,915 15,201 (320) 14,881 5.22 5.19 2,850 2,868 2.12
Step by Step Solution
3.49 Rating (149 Votes )
There are 3 Steps involved in it
Step: 1
Finding Trends in Growth or Decline sums in millions with the expectation of peer share information 2021 in 2020 in Revenues Net Sales 555233 7 519926 ...
Get Instant Access to Expert-Tailored Solutions
See step-by-step solutions with expert insights and AI powered tools for academic success
Step: 2

Step: 3

Ace Your Homework with AI
Get the answers you need in no time with our AI-driven, step-by-step assistance
Get Started


