Appropriate Applet link address: http://www.rossmanchance.com/ISIapplets.html
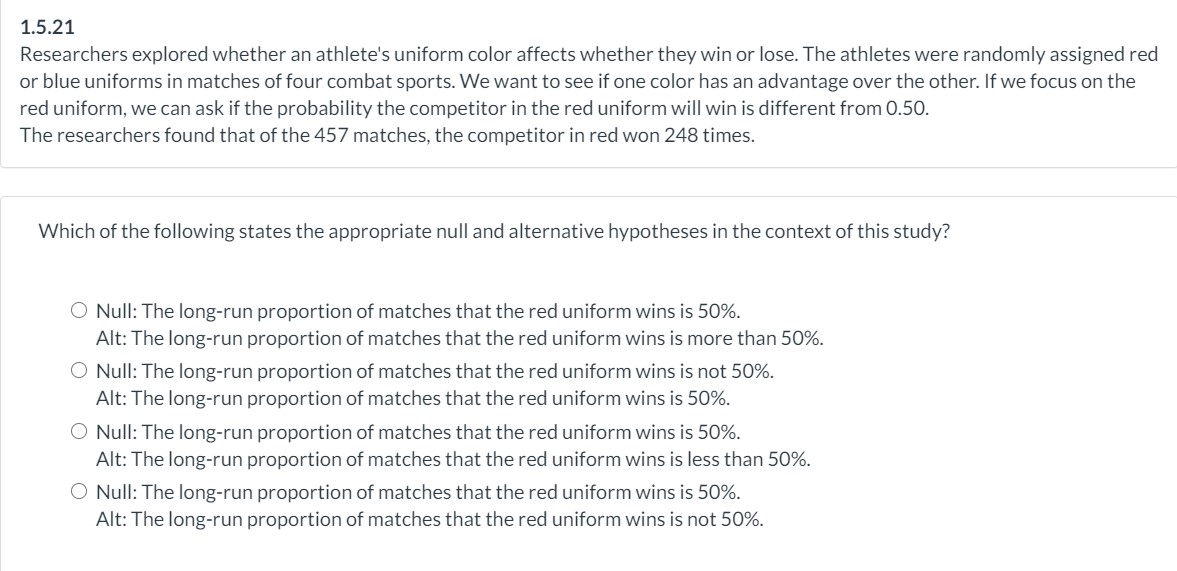
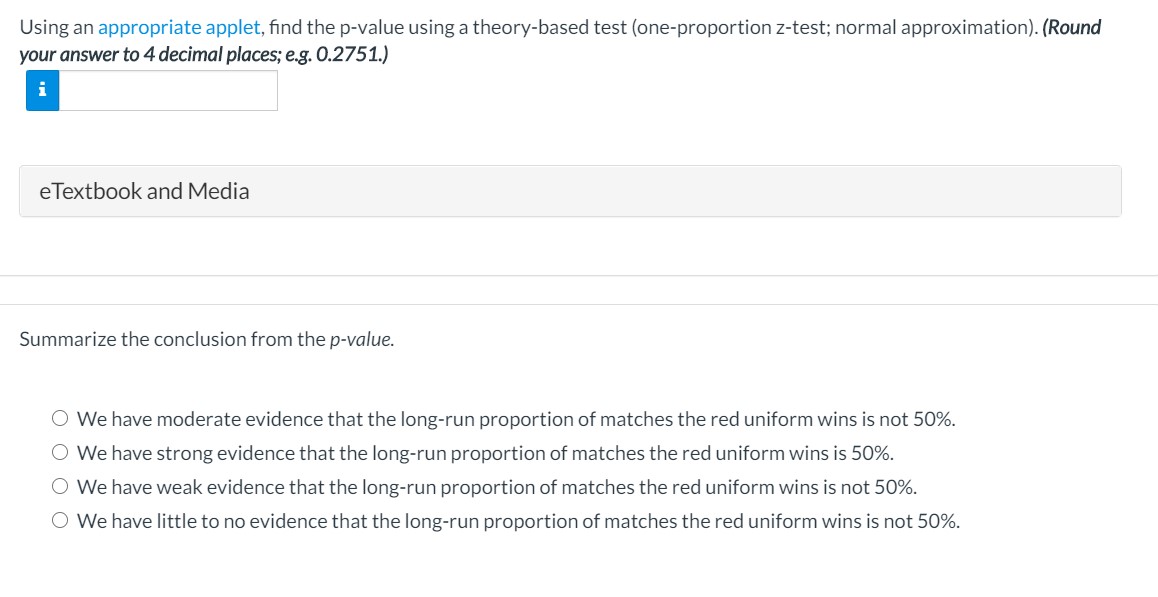
1.5.21 Researchers explored whether an athlete's uniform color affects whether they win or lose. The athletes were randomly assigned red or blue uniforms in matches of four combat sports. We want to see if one color has an advantage over the other. If we focus on the red uniform, we can ask if the probability the competitor in the red uniform will win is different from 0.50. The researchers found that of the 457 matches, the competitor in red won 248 times. Which of the following states the appropriate null and alternative hypotheses in the context of this study? 0 Null: The long-run proportion of matches that the red uniform wins is 50%. Alt: The long-run proportion of matches that the red uniform wins is more than 50%. O Null: The long-run proportion of matches that the red uniform wins is not 50%. Alt: The long-run proportion of matches that the red uniform wins is 50%. O Null: The long-run proportion of matches that the red uniform wins is 50%. Alt: The long-run proportion of matches that the red uniform wins is less than 50%. O Null: The long-run proportion of matches that the red uniform wins is 50%. Alt: The long-run proportion of matches that the red uniform wins is not 50%. Using an appropriate applet, nd the p-vaiue using a theory-based test {one-proportion z-test: normal approximation). (Round your answer to 4 decimal Places; 3.3. 0.2751.) eTextbook and Media Summarize the conclusion from the p-vaiue. 0 We have moderate evidence that the long-run proportion of matches the red uniform wins is not 50%. 0 We have strong evidence that the long-run proportion of matches the red uniform wins is 50%. 0 We have weak evidence that the long-run proportion of matches the red uniform wins is not 50%. 0 We have little to no evidence that the long-run proportion of matches the red uniform wins is not 50%. Interpret the meaning of the standardized statistic. The proportion of the sample in which red won is 1.83 standard deviations above the hypothesized null value of 0.5. O The proportion of the sample in which red won is 1.83 standard deviations below the hypothesized null value of 0.5. O The proportion of the sample in which red won is 1.83 standard deviations away from the hypothesized null value of 0.5