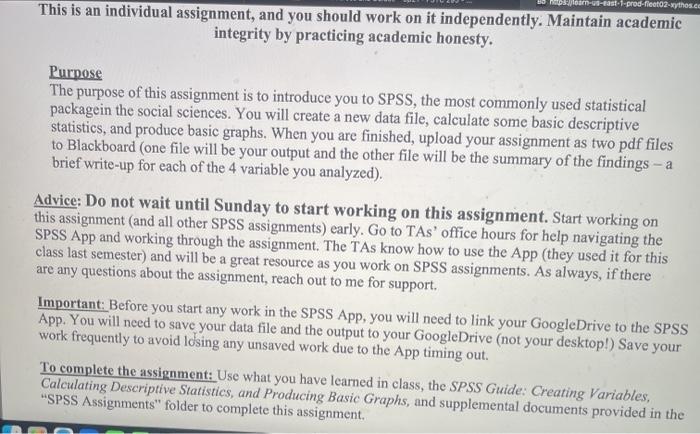
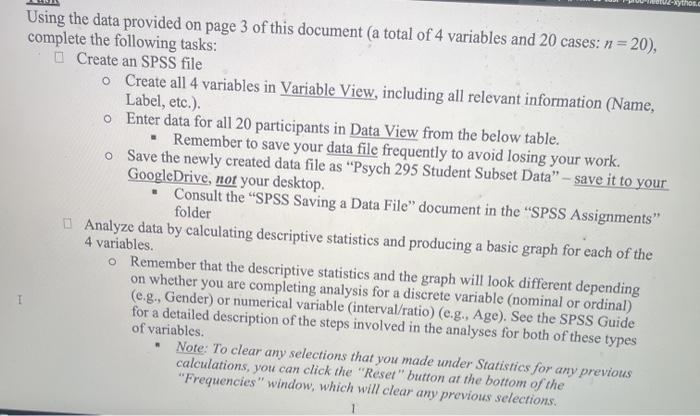
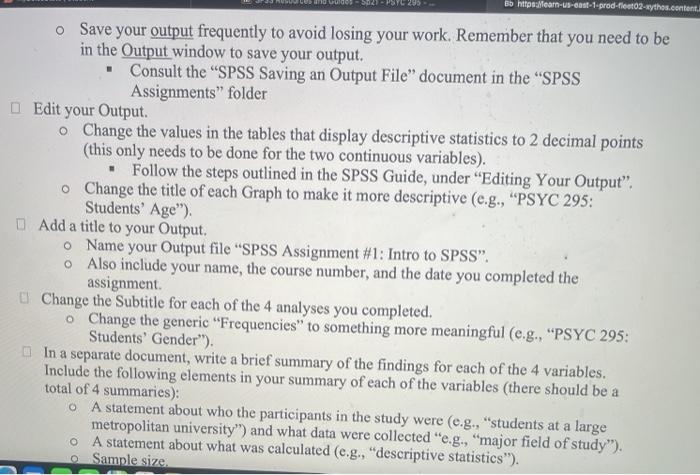
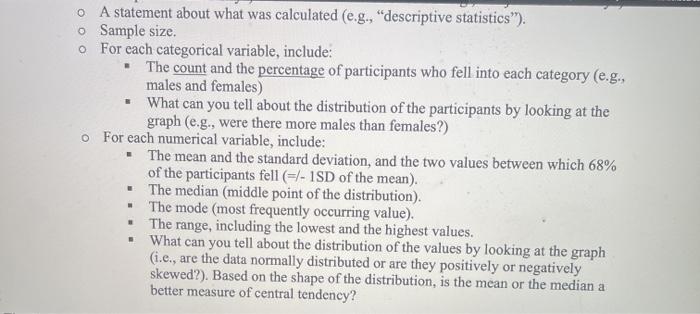
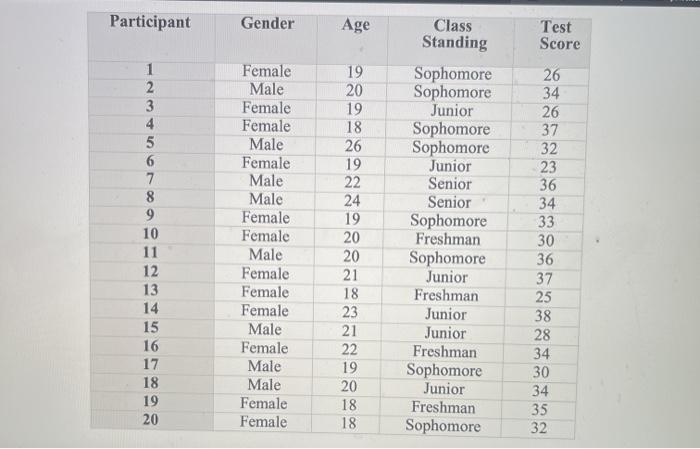
apsar-b-fast-prod-fiesta-xythos.co This is an individual assignment, and you should work on it independently. Maintain academic integrity by practicing academic honesty. Purpose The purpose of this assignment is to introduce you to SPSS, the most commonly used statistical packagein the social sciences. You will create a new data file, calculate some basic descriptive statistics, and produce basic graphs. When you are finished, upload your assignment as two pdf files to Blackboard (one file will be your output and the other file will be the summary of the findings - a brief write-up for each of the 4 variable you analyzed). Advice: Do not wait until Sunday to start working on this assignment. Start working on this assignment (and all other SPSS assignments) early. Go to TAs' office hours for help navigating the SPSS App and working through the assignment. The TAs know how to use the App (they used it for this class last semester) and will be a great resource as you work on SPSS assignments. As always, if there are any questions about the assignment, reach out to me for support. Important: Before you start any work in the SPSS App, you will need to link your GoogleDrive to the SPSS App. You will need to save your data file and the output to your Google Drive (not your desktop!) Save your work frequently to avoid ldsing any unsaved work due to the App timing out. To complete the assignment: Use what you have learned in class, the SPSS Guide: Creating Variables, Calculating Descriptive Statistics, and Producing Basic Graphs, and supplemental documents provided in the "SPSS Assignments" folder to complete this assignment, Mythose Using the data provided on page 3 of this document (a total of 4 variables and 20 cases: n = 20), complete the following tasks: Create an SPSS file o Create all 4 variables in Variable View, including all relevant information (Name, Label, etc.). Enter data for all 20 participants in Data View from the below table. Remember to save your data file frequently to avoid losing your work. o Save the newly created data file as "Psych 295 Student Subset Data" - save it to your GoogleDrive, not your desktop, Consult the "SPSS Saving a Data File" document in the "SPSS Assignments" folder Analyze data by calculating descriptive statistics and producing a basic graph for each of the 4 variables. o Remember that the descriptive statistics and the graph will look different depending on whether you are completing analysis for a discrete variable (nominal or ordinal) (e.g., Gender) or numerical variable interval/ratio) (e.g., Age). See the SPSS Guide for a detailed description of the steps involved in the analyses for both of these types of variables. Note: To clear any selections that you made under Statistics for any previous calculations, you can click the "Reset" button at the bottom of the "Frequencies" window, which will clear any previous selections. 1 65 https:ean-us-cast-1.prod-fleetO2-uythos.content o Save your output frequently to avoid losing your work. Remember that you need to be in the Output window to save your output. Consult the "SPSS Saving an Output File document in the "SPSS Assignments" folder Edit your Output Change the values in the tables that display descriptive statistics to 2 decimal points (this only needs to be done for the two continuous variables). . Follow the steps outlined in the SPSS Guide, under "Editing Your Output". o Change the title of each Graph to make it more descriptive (e.g., "PSYC 295: Students' Age"). Add a title to your Output. o Name your Output file "SPSS Assignment #1: Intro to SPSS". Also include your name, the course number, and the date you completed the assignment D Change the Subtitle for each of the 4 analyses you completed. o Change the generic "Frequencies" to something more meaningful (e.g., "PSYC 295: Students' Gender"). In a separate document, write a brief summary of the findings for each of the 4 variables. Include the following elements in your summary of each of the variables (there should be a total of 4 summaries): o A statement about who the participants in the study were (e.g., "students at a large metropolitan university) and what data were collected "e.g., "major field of study"). o A statement about what was calculated (e.g., "descriptive statistics"). Sample size. o A statement about what was calculated (e.g., "descriptive statistics"). o Sample size. o For each categorical variable, include: The count and the percentage of participants who fell into each category (e.g., males and females) What can you tell about the distribution of the participants by looking at the graph (e.g., were there more males than females?) o For each numerical variable, include: . The mean and the standard deviation, and the two values between which 68% of the participants fell (=/- 1SD of the mean). The median (middle point of the distribution). The mode (most frequently occurring value). The range, including the lowest and the highest values. What can you tell about the distribution of the values by looking at the graph (i.e., are the data normally distributed or are they positively or negatively skewed?). Based on the shape of the distribution, is the mean or the median a better measure of central tendency? Participant Gender Age Class Standing Test Score 1 2 3 26 34 26 37 32 23 36 34 5 6 7 8 9 10 11 12 13 14 15 16 17 18 19 20 Female Male Female Female Male Female Male Male Female Female Male Female Female Female Male Female Male Male Female Female 19 20 19 18 26 19 22 24 19 20 20 21 18 23 21 22 19 20 18 18 Sophomore Sophomore Junior Sophomore Sophomore Junior Senior Senior Sophomore Freshman Sophomore Junior Freshman Junior Junior Freshman Sophomore Junior Freshman Sophomore 33 30 36 37 25 38 28 34 30 34 35 32 apsar-b-fast-prod-fiesta-xythos.co This is an individual assignment, and you should work on it independently. Maintain academic integrity by practicing academic honesty. Purpose The purpose of this assignment is to introduce you to SPSS, the most commonly used statistical packagein the social sciences. You will create a new data file, calculate some basic descriptive statistics, and produce basic graphs. When you are finished, upload your assignment as two pdf files to Blackboard (one file will be your output and the other file will be the summary of the findings - a brief write-up for each of the 4 variable you analyzed). Advice: Do not wait until Sunday to start working on this assignment. Start working on this assignment (and all other SPSS assignments) early. Go to TAs' office hours for help navigating the SPSS App and working through the assignment. The TAs know how to use the App (they used it for this class last semester) and will be a great resource as you work on SPSS assignments. As always, if there are any questions about the assignment, reach out to me for support. Important: Before you start any work in the SPSS App, you will need to link your GoogleDrive to the SPSS App. You will need to save your data file and the output to your Google Drive (not your desktop!) Save your work frequently to avoid ldsing any unsaved work due to the App timing out. To complete the assignment: Use what you have learned in class, the SPSS Guide: Creating Variables, Calculating Descriptive Statistics, and Producing Basic Graphs, and supplemental documents provided in the "SPSS Assignments" folder to complete this assignment, Mythose Using the data provided on page 3 of this document (a total of 4 variables and 20 cases: n = 20), complete the following tasks: Create an SPSS file o Create all 4 variables in Variable View, including all relevant information (Name, Label, etc.). Enter data for all 20 participants in Data View from the below table. Remember to save your data file frequently to avoid losing your work. o Save the newly created data file as "Psych 295 Student Subset Data" - save it to your GoogleDrive, not your desktop, Consult the "SPSS Saving a Data File" document in the "SPSS Assignments" folder Analyze data by calculating descriptive statistics and producing a basic graph for each of the 4 variables. o Remember that the descriptive statistics and the graph will look different depending on whether you are completing analysis for a discrete variable (nominal or ordinal) (e.g., Gender) or numerical variable interval/ratio) (e.g., Age). See the SPSS Guide for a detailed description of the steps involved in the analyses for both of these types of variables. Note: To clear any selections that you made under Statistics for any previous calculations, you can click the "Reset" button at the bottom of the "Frequencies" window, which will clear any previous selections. 1 65 https:ean-us-cast-1.prod-fleetO2-uythos.content o Save your output frequently to avoid losing your work. Remember that you need to be in the Output window to save your output. Consult the "SPSS Saving an Output File document in the "SPSS Assignments" folder Edit your Output Change the values in the tables that display descriptive statistics to 2 decimal points (this only needs to be done for the two continuous variables). . Follow the steps outlined in the SPSS Guide, under "Editing Your Output". o Change the title of each Graph to make it more descriptive (e.g., "PSYC 295: Students' Age"). Add a title to your Output. o Name your Output file "SPSS Assignment #1: Intro to SPSS". Also include your name, the course number, and the date you completed the assignment D Change the Subtitle for each of the 4 analyses you completed. o Change the generic "Frequencies" to something more meaningful (e.g., "PSYC 295: Students' Gender"). In a separate document, write a brief summary of the findings for each of the 4 variables. Include the following elements in your summary of each of the variables (there should be a total of 4 summaries): o A statement about who the participants in the study were (e.g., "students at a large metropolitan university) and what data were collected "e.g., "major field of study"). o A statement about what was calculated (e.g., "descriptive statistics"). Sample size. o A statement about what was calculated (e.g., "descriptive statistics"). o Sample size. o For each categorical variable, include: The count and the percentage of participants who fell into each category (e.g., males and females) What can you tell about the distribution of the participants by looking at the graph (e.g., were there more males than females?) o For each numerical variable, include: . The mean and the standard deviation, and the two values between which 68% of the participants fell (=/- 1SD of the mean). The median (middle point of the distribution). The mode (most frequently occurring value). The range, including the lowest and the highest values. What can you tell about the distribution of the values by looking at the graph (i.e., are the data normally distributed or are they positively or negatively skewed?). Based on the shape of the distribution, is the mean or the median a better measure of central tendency? Participant Gender Age Class Standing Test Score 1 2 3 26 34 26 37 32 23 36 34 5 6 7 8 9 10 11 12 13 14 15 16 17 18 19 20 Female Male Female Female Male Female Male Male Female Female Male Female Female Female Male Female Male Male Female Female 19 20 19 18 26 19 22 24 19 20 20 21 18 23 21 22 19 20 18 18 Sophomore Sophomore Junior Sophomore Sophomore Junior Senior Senior Sophomore Freshman Sophomore Junior Freshman Junior Junior Freshman Sophomore Junior Freshman Sophomore 33 30 36 37 25 38 28 34 30 34 35 32