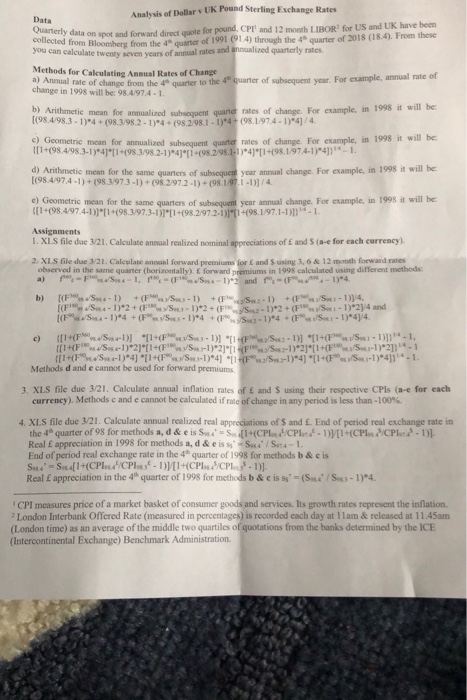
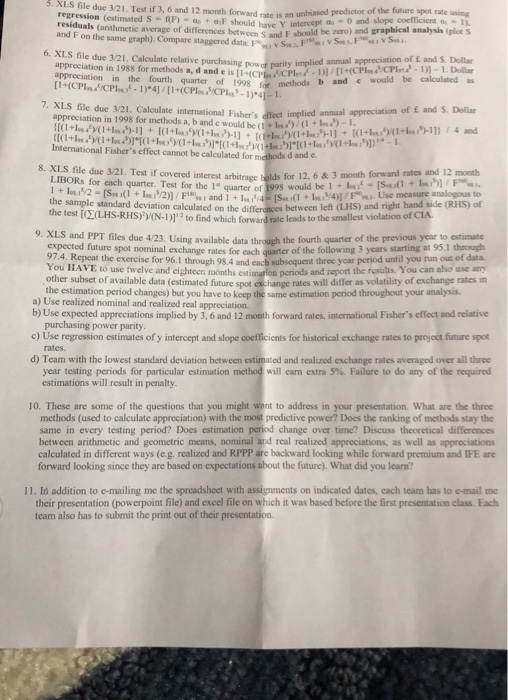
ar v UK Pound Sterling Exchange Rates Data sctru data on spot and forward direct uote for pound, C collected from CPI and 12 month LIBOR' for US and UK have been from the 4 quarter of 1991 14) through the 4 quarter of 2018 (18.4). From these quarterly rates te twenty seven years of anmual rates and aninualized al Annual rate of change from the 4 quarter to the 4 quarter of subsequent year. For example, annual rate of change in 1998 will be: 98.4/974-1 b) Arithmetie mean for annualized subsequert 98.4/98.3-1)*4+(983/98.2-1)4+ (98.2 98.1-1)*4+ (98.1/97.4 1)*4/4 9isent quartet rates of change. For example, in 1998 it will be c) Geometric mean for annualized subsequent quarter rates of change. For example, in 1998 it will be [1+(98.4198.3-1)*411+(98.3.98.2-1)*4[ (98298.1-1)41+(98.1.974-1)4 d) Arithmetic mean for the same quarters of 108.4974 1)+ 98 3973-1)+(98.29721)- 08.19.1-1)/4 e) Geometric mean subsouent year annual change For example, in 1998 it will be for the same quarters of subsequent year annual change. For example, in 1998 it will be +498.4/97.4-DP1+(98.397.3-1)1+98.2972-0)198.1/97.1-1DD-1 Assignments 1. XI.S file due 3/21.Calculate anpual realized nominal appreciations of E and S (a-e for each currency) 2.XLS file due 321. Calculate annual forward premium tor and Susang 3, 6 & 12 month forwardrates observed in the same quarter (horizontally). E forward premiums in 1998 calculated using different mcthods Methods d and e cannot be used for forward premiums 3. XLS file due 3/21. Calculate annual inflation rates of E and S using their respective CPls (a-e for each currency). Methods c and e cannot be calculated ifratepfchange in any period is less than-100% 4. XLS file due 3/21. Calculate annual realized real appreciations of S and . End of period real exchange rate in the 4 quarter of 98 for methods a, d & e is S1(CPl /CPlnI (CPl Real appreciation in 1998 for methods a, d & e issS/S-1 End of period real exchange rate in the 4 quarter of 1998 for methods b & c is CPl-D)). Real appreciation in the 4h quarter of 1998 for methods b & c is s'- (SS-)*4. CPI measures price of a market basket of consumer goods and services. Its growth rates represent the inflation. London Interbank Offered Rate (measured in percentages) is recorded cach day at 11am& released at 11.45am (London time) as an average of the middle two quartiles of quotations from the banks determined by the ICE (Intercontinental Exchange) Benchmark Administration. 5. XI.S file due 3/21. Test if 3, 6 and 12 month forward r spot rate regression (estimated S-RF)-ao + a,F should have Y intercept rate is an unbiased predictor of the future residuals (arithmetic average of differences between S and F a- and slope coeficient o n ysis (plot s and F on the same graph). Compare staggcred data: Pw, v Sw 6. XLS file due 3/21. Calculate relative purchasing p should be zero) and graphical anal appreciation in 1988 for methods a, dand e is [1 +CTL/CP1r/ Dollar 1. Dollar power parity implied annual appreciation of E and S [ 1+(CP"//CPleef-1 ).4] / [ 1+(CPhasCPL's-1).41-1 methods b and would be calculated as 7. XLS file due 3/21. Calculate intenational appreciation in 1998 for methods a, b and c would be-huip d . ha) . Fisher's dfect implied annual appreciation of E and S. Dollar International Fisher's effect cannot be calculated for LIBORs for each quarter. Test for the 1" quarter of 1998 wou the sample standard deviation calculated on the dierenees between left (LHS) and right hand side (RHS) of d and e 8. XLS file due 3/21. Test if covered interest arbitrage holds for 12. 6 &3 month forward rates and 12 month 4"IS" (1 + 1"74)] / F-u. Use measure anal gous to 2 -Ba (1+ 1" "2)] / F "m and i 1 the fest E(LHS-RHS(N-1)]12 to find which forward rate leads to the smallest violation of CIA 9. XLS and PPT files due 4/23. Using available data through the fourth quarter of the previous year to estimate e through expected future spot nominal exchange rates for each quarter o the following 3 years starting at 951 weteat the exercise for 96.I through 98. 4 and each subsequent three ycar period until you run out of data. You HAVE to use twelve and cighteen months other subset of available data (estimated future spot exchange rates estimarfon pcriods and report the rosults. You can also use any f will differ as volatility of exchange rates in the estimation period changes) but you have to keep the same estimation period throughout your analysis a) Use realized nominal and realized real appreciation. b) Use expected appreciations implied by 3, 6 and 12 month forward rates, international Fisher's effect and relative purchasing power parity c) Use regression estimates of y intercept and slope coefficients for historical exchange rates to project future spot d) Team with the lowest standard deviation between estimated and realized exchange rates averaged over all three year testing periods for particular estimation method will earn extra 5% Failure to do any of the requred estimations will result in penalty 10. These are some of the questions that you might want to address in your presentation. What are the three methods (used to calculate appreciation) with the most predictive power? Does the ranking of methods stay the same in every testing period? Does estimation period change over time? Discuss theoretical differences between arithmetic and geometric means, nominal and real realized appreciations, as well as appreciations calculated in different ways (e.g. realized and RPPP are backward looking while forward premium and IFE are forward looking since they are based on expectations about the future). What did you learn? 11. In addition to e-mailing me the spreadsheet with assignments on indicated dates, each team has to e-mail me their presentation (powerpoint file) and excel file on which it was based before the first presentation class. Each team also has to submit the print out of their presentation. ar v UK Pound Sterling Exchange Rates Data sctru data on spot and forward direct uote for pound, C collected from CPI and 12 month LIBOR' for US and UK have been from the 4 quarter of 1991 14) through the 4 quarter of 2018 (18.4). From these quarterly rates te twenty seven years of anmual rates and aninualized al Annual rate of change from the 4 quarter to the 4 quarter of subsequent year. For example, annual rate of change in 1998 will be: 98.4/974-1 b) Arithmetie mean for annualized subsequert 98.4/98.3-1)*4+(983/98.2-1)4+ (98.2 98.1-1)*4+ (98.1/97.4 1)*4/4 9isent quartet rates of change. For example, in 1998 it will be c) Geometric mean for annualized subsequent quarter rates of change. For example, in 1998 it will be [1+(98.4198.3-1)*411+(98.3.98.2-1)*4[ (98298.1-1)41+(98.1.974-1)4 d) Arithmetic mean for the same quarters of 108.4974 1)+ 98 3973-1)+(98.29721)- 08.19.1-1)/4 e) Geometric mean subsouent year annual change For example, in 1998 it will be for the same quarters of subsequent year annual change. For example, in 1998 it will be +498.4/97.4-DP1+(98.397.3-1)1+98.2972-0)198.1/97.1-1DD-1 Assignments 1. XI.S file due 3/21.Calculate anpual realized nominal appreciations of E and S (a-e for each currency) 2.XLS file due 321. Calculate annual forward premium tor and Susang 3, 6 & 12 month forwardrates observed in the same quarter (horizontally). E forward premiums in 1998 calculated using different mcthods Methods d and e cannot be used for forward premiums 3. XLS file due 3/21. Calculate annual inflation rates of E and S using their respective CPls (a-e for each currency). Methods c and e cannot be calculated ifratepfchange in any period is less than-100% 4. XLS file due 3/21. Calculate annual realized real appreciations of S and . End of period real exchange rate in the 4 quarter of 98 for methods a, d & e is S1(CPl /CPlnI (CPl Real appreciation in 1998 for methods a, d & e issS/S-1 End of period real exchange rate in the 4 quarter of 1998 for methods b & c is CPl-D)). Real appreciation in the 4h quarter of 1998 for methods b & c is s'- (SS-)*4. CPI measures price of a market basket of consumer goods and services. Its growth rates represent the inflation. London Interbank Offered Rate (measured in percentages) is recorded cach day at 11am& released at 11.45am (London time) as an average of the middle two quartiles of quotations from the banks determined by the ICE (Intercontinental Exchange) Benchmark Administration. 5. XI.S file due 3/21. Test if 3, 6 and 12 month forward r spot rate regression (estimated S-RF)-ao + a,F should have Y intercept rate is an unbiased predictor of the future residuals (arithmetic average of differences between S and F a- and slope coeficient o n ysis (plot s and F on the same graph). Compare staggcred data: Pw, v Sw 6. XLS file due 3/21. Calculate relative purchasing p should be zero) and graphical anal appreciation in 1988 for methods a, dand e is [1 +CTL/CP1r/ Dollar 1. Dollar power parity implied annual appreciation of E and S [ 1+(CP"//CPleef-1 ).4] / [ 1+(CPhasCPL's-1).41-1 methods b and would be calculated as 7. XLS file due 3/21. Calculate intenational appreciation in 1998 for methods a, b and c would be-huip d . ha) . Fisher's dfect implied annual appreciation of E and S. Dollar International Fisher's effect cannot be calculated for LIBORs for each quarter. Test for the 1" quarter of 1998 wou the sample standard deviation calculated on the dierenees between left (LHS) and right hand side (RHS) of d and e 8. XLS file due 3/21. Test if covered interest arbitrage holds for 12. 6 &3 month forward rates and 12 month 4"IS" (1 + 1"74)] / F-u. Use measure anal gous to 2 -Ba (1+ 1" "2)] / F "m and i 1 the fest E(LHS-RHS(N-1)]12 to find which forward rate leads to the smallest violation of CIA 9. XLS and PPT files due 4/23. Using available data through the fourth quarter of the previous year to estimate e through expected future spot nominal exchange rates for each quarter o the following 3 years starting at 951 weteat the exercise for 96.I through 98. 4 and each subsequent three ycar period until you run out of data. You HAVE to use twelve and cighteen months other subset of available data (estimated future spot exchange rates estimarfon pcriods and report the rosults. You can also use any f will differ as volatility of exchange rates in the estimation period changes) but you have to keep the same estimation period throughout your analysis a) Use realized nominal and realized real appreciation. b) Use expected appreciations implied by 3, 6 and 12 month forward rates, international Fisher's effect and relative purchasing power parity c) Use regression estimates of y intercept and slope coefficients for historical exchange rates to project future spot d) Team with the lowest standard deviation between estimated and realized exchange rates averaged over all three year testing periods for particular estimation method will earn extra 5% Failure to do any of the requred estimations will result in penalty 10. These are some of the questions that you might want to address in your presentation. What are the three methods (used to calculate appreciation) with the most predictive power? Does the ranking of methods stay the same in every testing period? Does estimation period change over time? Discuss theoretical differences between arithmetic and geometric means, nominal and real realized appreciations, as well as appreciations calculated in different ways (e.g. realized and RPPP are backward looking while forward premium and IFE are forward looking since they are based on expectations about the future). What did you learn? 11. In addition to e-mailing me the spreadsheet with assignments on indicated dates, each team has to e-mail me their presentation (powerpoint file) and excel file on which it was based before the first presentation class. Each team also has to submit the print out of their presentation