Question
Are more selective colleges more expensive? This is a question asked by students enrolled in a statistics course at a liberal arts college. To answer
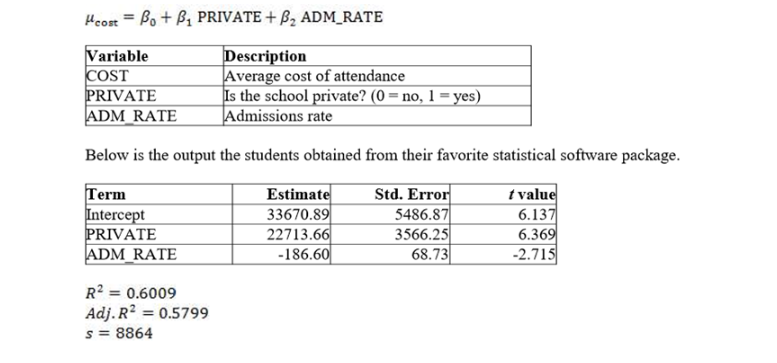
Are more selective colleges more expensive? This is a question asked by students enrolled in a statistics course at a liberal arts college. To answer this question, the students collected information on a random sample of 41 liberal arts colleges across the nation. They considered the regression model given below.
Following questions will be answered based on the output below.
Which BEST describes the association between average cost and the admissions rate, based on a correlation of r = 0.418?
| A. | positive, linear, moderate | |
| B. | negative, linear, moderate
| |
| C. | negative, linear, strong
| |
| D. | no clear association |
-
What is the regression standard error for the fitted model?
A. 5486.87
B. 8864
C. 0.6009
D. 5799
-
What proportion of the variation in the average cost of attendance does this multiple regression model explain?
A. .5799
B. .6800
C. .6009
D. .8864
-
What is the interpretation of the estimated slope associated with PRIVATE?
A. For each 1-unit increase in admission rate, the average cost of attendance increases by $22,713.66,
holding the private constant.
B. The average cost of attendance for a private school is $22,713.66 higher than the average cost for a public school,
assuming that they have the same admissions rate.
C. Private schools are $22,713.66 more expensive, on average.
D. None of the answers is correct.
-
What is the interpretation of the estimated slope associated with ADM_RATE?
A. A 1% increase in the admissions rate causes the average cost of attendance to decrease by $186.60.
B. As the cost of attendance decreases by $186.60, the admissions rate increases by 1%.
C. A 1% decrease in the admissions rate is associated with a $186.60 decrease in the average cost of attendance,
holding all else constant.
D. A 1% increase in the admissions rate is associated with a $186.60 decrease in the average cost of attendance,
holding all else constant.
-
Below are the VIF values of independent variables from the regression model. Do these indicate any potential issues with the model?
PRIVATE ADM_RATE
1.084 3.066
A. Yes, VIF values are below 10 so the model suffers from multicollinearity.
B. No, VIF values are below 10 so the model does not suffer from multicollinearity.
C. The information is not enough to answer the question.
D. None of the answers is correct.

Step by Step Solution
There are 3 Steps involved in it
Step: 1

Get Instant Access to Expert-Tailored Solutions
See step-by-step solutions with expert insights and AI powered tools for academic success
Step: 2

Step: 3

Ace Your Homework with AI
Get the answers you need in no time with our AI-driven, step-by-step assistance
Get Started


