

Question
Are the variances of the unemployment percentages similar for Texas and Oklahoma? First calculate by hand the ratio of the larger variance to the smaller
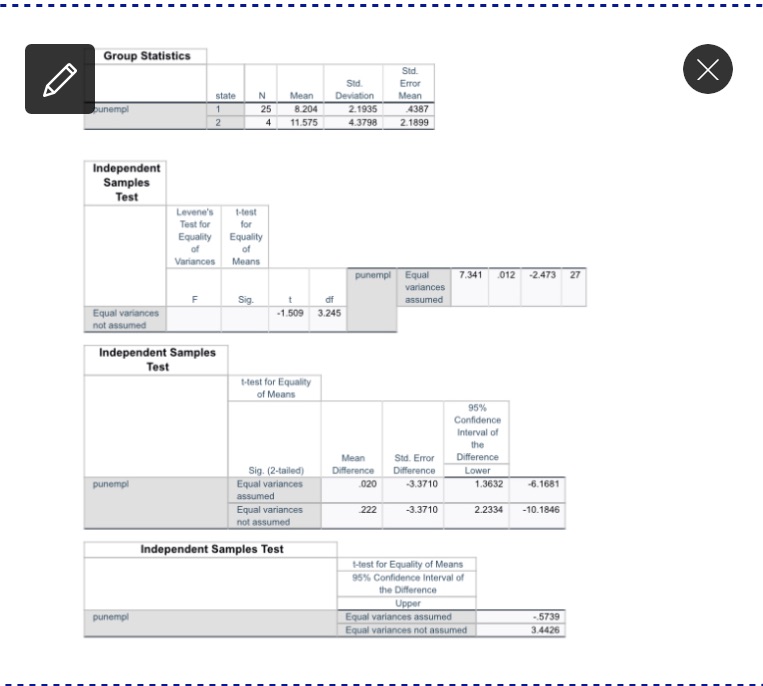
Are the variances of the unemployment percentages similar for Texas and Oklahoma? First calculate by hand the ratio of the larger variance to the smaller variance. Are the variances similar given the criterion for equal variances presented in class? Explain. How can you tell from your computer output? Which set of t-test results should you then use? Explain why. Does it make any difference in your analysis which set of t-test results you use? Explain why or why not.Use the standard deviations from your computer output to calculate the standard error of the difference between the two means. Work out your computations to at least 4 places to the right of the decimal point. Calculate the t-test. Your obtained t-test should be very similar to that from your computer output. If not, check your hand computations until your answer is similar to that of your output.Interpret your findings answering the following questions in order to explain what the statistical test tells you about the nature of the difference between Texas and Oklahoma metropolitan unemployment. Explain why you reject or do not reject the null hypothesis. If you do reject the null hypothesis, what is the probability of making a Type 1 error according to the t-table in APPENDIX C? What is the level of statistical significance given in your computer output? If you found a statistically significant difference, what is the nature of the difference between the mean unemployment percentages of the two states?Calculate a 95% confidence interval for the true difference between the state MSA unemployment percentages. Again, assume the variances are equal. Use the information from your computer output to show how the upper and lower boundaries of the confidence interval were obtained. Interpret the value of the confidence interval for the difference in state MSA unemployment percentages. What does the confidence interval specifically tell you about the difference in state MSA unemployment percentages?
Step by Step Solution
There are 3 Steps involved in it
Step: 1

Get Instant Access to Expert-Tailored Solutions
See step-by-step solutions with expert insights and AI powered tools for academic success
Step: 2

Step: 3
Ace Your Homework with AI
Get the answers you need in no time with our AI-driven, step-by-step assistance
Get Started
Mathematics Concepts With Applications
Authors: Charles P McKeague
1st Edition
1630983136, 9781630983130