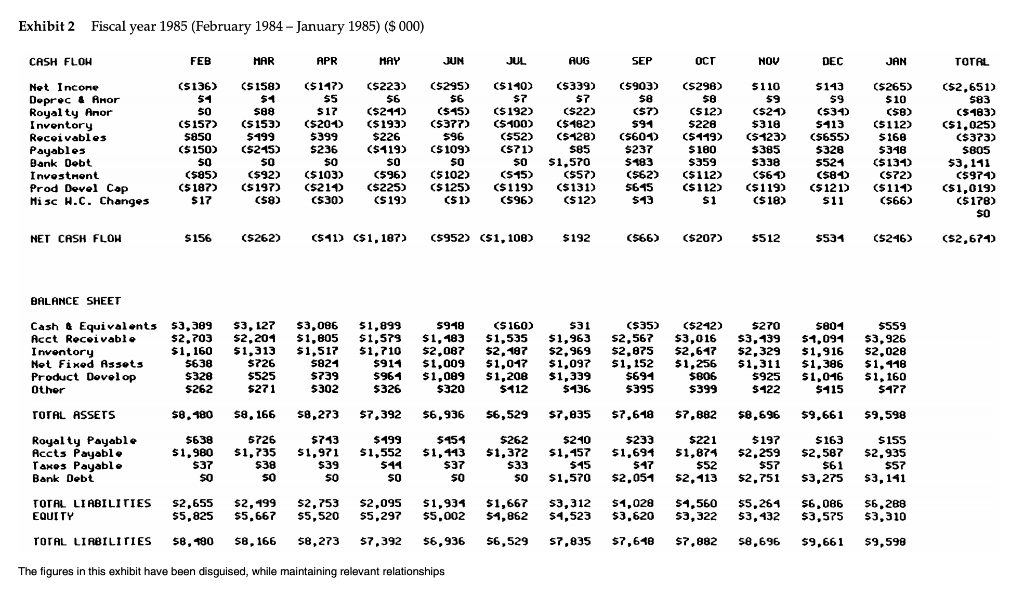
Are your receivables in good shape? Yes or no, assuming stated terms of net 30 Support this answer by calculating the days sales outstanding.

Exhibit 2 Fiscal year 1985 (February 1984 - January 1985) ($ 000) CASH FLOH FEB HAR APR HAY JUN JUL AUG SEP OCT OCT NOV DEC JAN TOTAL Net Incone Deprec & Anor Royalty Anor Inventory Receivables Payables Bank Debt Investment Prod Devel Cap Misc H.C. Changes (5136) $1 50 ($157) 5850 ($150) 50 (585) (5187) $17 (5158) 51 $89 (5153) 5499 (5215) $0 (592) (5197) (58) ($117) 55 $17 (5201) 5399 $236 $0 ($103) (5210) (530) ($223) $6 ($211) ($193) $226 ($119) $0 (596) ($225) (519) (5295) $6 ($15) (5377) 596 ($109) 50 (5102) ($125) (51) ($110) $7 ($192) (5400) (552) (571) $0 (515) ($119) (596) ($339) 57 C$22) (5482) (5428) $85 $1,570 (557) ($131) (5903) $8 (57) 594 (5601) $237 5183 (562) 5615 $13 (5298) 50 (512) $228 ($119) $180 $359 ($112) ($112) $1 5110 59 (521) $318 ($123) $385 $338 C$61) ($119) (518) $143 59 (534) 5413 (5655) $328 5524 (581) ($1212 $11 (5265) $10 (58) ($112) 5166 53-18 ($131) (572) ($111) ($66) (52,651) 583 ($183) (51,025) ($373) $805 $3,111 (5974) (51,019) ($178) $o (512) NET CASH FLOH $156 (5262) (511) (51,187) (5952) (51,108) $192 (566) ($207) $512 $534 (5246) (52,671) BALANCE SHEET Cash & Equivalents 53, 389 Acct Receivable $2.703 Inventory $1,160 Net Fixed Assets 5638 Product Develop $328 Other $262 $3,127 $2,201 $1,313 $726 $525 5271 $3,086 $1,805 $1,517 5821 $739 5302 51,899 $1,579 51,710 $911 5961 $326 5918 $1,183 $2,087 $1,009 $1,009 $320 (5160) $1,535 52, 187 51,017 $1,208 $112 $31 $1,963 $2,969 $1,097 $1,339 $136 (535) $2,567 52,875 51, 152 5694 5395 (5242) $3,016 52,617 $1,256 $806 $399 $270 $3,139 $2,329 51.311 5925 5122 $804 $1,091 $1,916 $1,386 51,016 $115 $559 $3,926 $2,028 $1,418 $1,160 $477 TOTAL ASSETS 58. 180 58,166 58,273 57,392 $6,936 56,529 $7,835 57,618 57,882 $8,696 $9,661 59,598 Royalty Payable Accts Payable Taxes Payable Bank Debt $638 $1,980 $37 $0 5726 $1,735 $38 SO 5713 51,971 $39 50 $199 $1,552 544 $0 5454 $1,443 $37 50 $262 $1,372 533 $0 5210 $1,157 $15 $1,570 5233 51,691 $47 $2.051 $221 51,874 $52 52,113 $197 $2,259 $57 $2.751 5163 $2,587 561 $3,275 $155 $2.935 $57 $3,141 TOTAL LIABILITIES EQUITY $2,655 $5,825 $2,499 $5.667 $2,753 55,520 $2,095 55,297 $1,934 $5.002 $1,667 $4,862 $3,312 $4,523 $1,028 $3,620 $7,648 $4,560 53,322 $5,261 53, 432 $6,066 $3,575 56,288 $3,310 TOTAL LIABILITIES $8,190 58,166 58,273 $7,392 $6,936 56,529 $7,835 $7,882 58,696 59,661 59,598 The figures in this exhibit have been disguised, while maintaining relevant relationships Exhibit 2 Fiscal year 1985 (February 1984 - January 1985) ($ 000) CASH FLOH FEB HAR APR HAY JUN JUL AUG SEP OCT OCT NOV DEC JAN TOTAL Net Incone Deprec & Anor Royalty Anor Inventory Receivables Payables Bank Debt Investment Prod Devel Cap Misc H.C. Changes (5136) $1 50 ($157) 5850 ($150) 50 (585) (5187) $17 (5158) 51 $89 (5153) 5499 (5215) $0 (592) (5197) (58) ($117) 55 $17 (5201) 5399 $236 $0 ($103) (5210) (530) ($223) $6 ($211) ($193) $226 ($119) $0 (596) ($225) (519) (5295) $6 ($15) (5377) 596 ($109) 50 (5102) ($125) (51) ($110) $7 ($192) (5400) (552) (571) $0 (515) ($119) (596) ($339) 57 C$22) (5482) (5428) $85 $1,570 (557) ($131) (5903) $8 (57) 594 (5601) $237 5183 (562) 5615 $13 (5298) 50 (512) $228 ($119) $180 $359 ($112) ($112) $1 5110 59 (521) $318 ($123) $385 $338 C$61) ($119) (518) $143 59 (534) 5413 (5655) $328 5524 (581) ($1212 $11 (5265) $10 (58) ($112) 5166 53-18 ($131) (572) ($111) ($66) (52,651) 583 ($183) (51,025) ($373) $805 $3,111 (5974) (51,019) ($178) $o (512) NET CASH FLOH $156 (5262) (511) (51,187) (5952) (51,108) $192 (566) ($207) $512 $534 (5246) (52,671) BALANCE SHEET Cash & Equivalents 53, 389 Acct Receivable $2.703 Inventory $1,160 Net Fixed Assets 5638 Product Develop $328 Other $262 $3,127 $2,201 $1,313 $726 $525 5271 $3,086 $1,805 $1,517 5821 $739 5302 51,899 $1,579 51,710 $911 5961 $326 5918 $1,183 $2,087 $1,009 $1,009 $320 (5160) $1,535 52, 187 51,017 $1,208 $112 $31 $1,963 $2,969 $1,097 $1,339 $136 (535) $2,567 52,875 51, 152 5694 5395 (5242) $3,016 52,617 $1,256 $806 $399 $270 $3,139 $2,329 51.311 5925 5122 $804 $1,091 $1,916 $1,386 51,016 $115 $559 $3,926 $2,028 $1,418 $1,160 $477 TOTAL ASSETS 58. 180 58,166 58,273 57,392 $6,936 56,529 $7,835 57,618 57,882 $8,696 $9,661 59,598 Royalty Payable Accts Payable Taxes Payable Bank Debt $638 $1,980 $37 $0 5726 $1,735 $38 SO 5713 51,971 $39 50 $199 $1,552 544 $0 5454 $1,443 $37 50 $262 $1,372 533 $0 5210 $1,157 $15 $1,570 5233 51,691 $47 $2.051 $221 51,874 $52 52,113 $197 $2,259 $57 $2.751 5163 $2,587 561 $3,275 $155 $2.935 $57 $3,141 TOTAL LIABILITIES EQUITY $2,655 $5,825 $2,499 $5.667 $2,753 55,520 $2,095 55,297 $1,934 $5.002 $1,667 $4,862 $3,312 $4,523 $1,028 $3,620 $7,648 $4,560 53,322 $5,261 53, 432 $6,066 $3,575 56,288 $3,310 TOTAL LIABILITIES $8,190 58,166 58,273 $7,392 $6,936 56,529 $7,835 $7,882 58,696 59,661 59,598 The figures in this exhibit have been disguised, while maintaining relevant relationships


