

Answered step by step
Verified Expert Solution
Question
1 Approved Answer
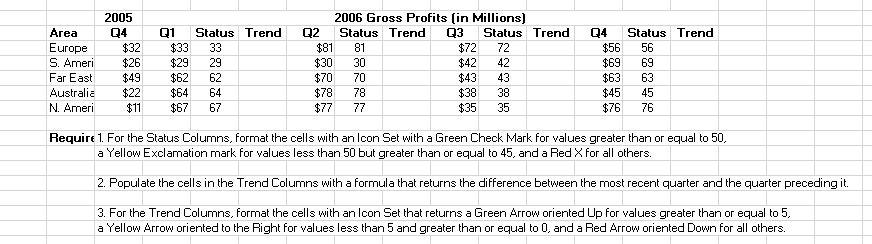
Area Europe S. Ameri Far East Australia N. Ameri 2005 Q4 $32 $26 $49 $22 $11 Q1 $33 $29 $62 $64 $67 Status Trend 33
Step by Step Solution
There are 3 Steps involved in it
Step: 1

Get Instant Access to Expert-Tailored Solutions
See step-by-step solutions with expert insights and AI powered tools for academic success
Step: 2

Step: 3
Ace Your Homework with AI
Get the answers you need in no time with our AI-driven, step-by-step assistance
Get Started
SQL FOR BEGINNERS THE FUNDAMENTAL LANGUAGE FOR DATA SCIENCE TO MASTERING DATABASES AN ESSENTIAL GUIDE YOU CANNOT MISS TO LEARN SQL IN 7 DAYS OR LESS WITH HANDS ON PROJECTS
Authors: ERICK THOMPSON
1st Edition
B08KGT7GG2, 979-8686327658